
Jehi T, Santos H. Impact of health education intervention and intrinsic factors on microbiota in overweight individuals: a randomized clinical trial .HPHR. 2024;64. 10.54111/0001/LLL6
The first objective was to assess the influence of a health education program that placed emphasis on improving physical activity level and diet quality on the microbiota. The second objective was to investigate the effect of extrinsic and intrinsic factors on the responses of individual microbiota taxa to the health education intervention.
A secondary analysis of the Full Plate Diet (FPD) trial, a randomized controlled, clinical trial which included a 10-week health education program at Loma Linda, CA.
Drayson Center, Loma Linda University, CA.
Fecal samples were collected at baseline (Pre) and after the termination of the health education intervention (Post). Bacterial DNA were extracted and 16S rRNA amplicon were then sequenced.
No significant differences were observed, for any of the groups, in the α or ß diversities between baseline and post-intervention. Baseline microbiome significantly determined the shift of the individual microbial taxa; however, treatment type, gender, and baseline BMI, did not predict this shift.
A health education intervention emphasizing stress management and improvement in diet quality and physical activity did not have much influence on abundance and diversity of microbiota in a group of obese middle-aged adults. The shift in the microbiome, however, and the responsiveness to health education intervention could be predicted by the baseline microbiome level.
Registration number is NCT03232970; July 28, 2017
The gut microbiota are a highly diverse, metabolically active and complex community of microorganisms that have a vast number of biological functions which benefit the host including the production of vitamins 1, fermentation of undigested nutrients 2,3, maturation of the immune system 4, and regulation of glucose and lipid metabolism 5. The most abundant bacterial phyla that are detected in human feces are Bacteroidetes and Firmicutes 6.
Various lifestyle factors modulate the microbiota’s composition and metabolic activity, and thus impact the roles they play in the prevention/development of chronic diseases 7. Smoking, for instance, increases Bacteroides-Prevotella, 2 main genera within the Bacteroidetes phyla, in healthy individuals which, in-return, could increase the risk of Crohn’s Disease 8. Stress, another lifestyle factor, can affect the colonic motor activity and thus alter gut microbiota profiles, including the reduction in the numbers of potentially beneficial Lactobacillus 9. Higher levels of physical activity and cardiorespiratory fitness have been shown to be associated with higher fecal bacterial alpha diversity and with increased level of certain phyla in the feces of healthy adults 10. Obesity has been shown to lead to shifts in gut microbial populations manifested through the increase in Firmicute and the reduction in Bacteroidetes 11,12.
Different dietary patterns could also modulate the gut bacterial communities 13,14. Adopting a plant-based diet, for instance, leads to an increase in the abundance of Prevotella 14,15. Long-term animal-based diets rich in animal protein and saturated fat, on the other hand, have been positively associated with bile-tolerant microorganisms such as Clostridia 13 and Bacteroides 16,17. The observed influence of the plant-based diet on the microbiota is related to polyphenols 18, and to dietary fibers 19, non-digestible carbohydrates and lignin 20. Polyphenols have been shown to increase the levels of Bifidobacterium and Lactobacillus; both play anti-pathogenic and anti-inflammatory roles and offer cardiovascular protection 18.
Even though the influence of different lifestyle factors on the microbiota is established by various studies 10,13,14, not much work has been carried out to translate their findings to the community. Further research is thus required to explore the effect of an intervention program that targets the community, by targeting different lifestyle factors, on the microbiome. Our Full Plate Diet (FPD) clinical trial has previously shown that a 10-week health education intervention improved the diet quality, reduced body weight, and decreased total cholesterol 21,22 in a group of middle-aged overweight individuals. In this secondary analysis of the FPD, the main purpose was to investigate the influence of this health education program on the bacterial community. We further assessed the effect of various extrinsic and intrinsic factors on the responses of individual bacterial taxa to the health education intervention, at different taxonomic levels.
Figure 1. Full Plate Diet Study Design
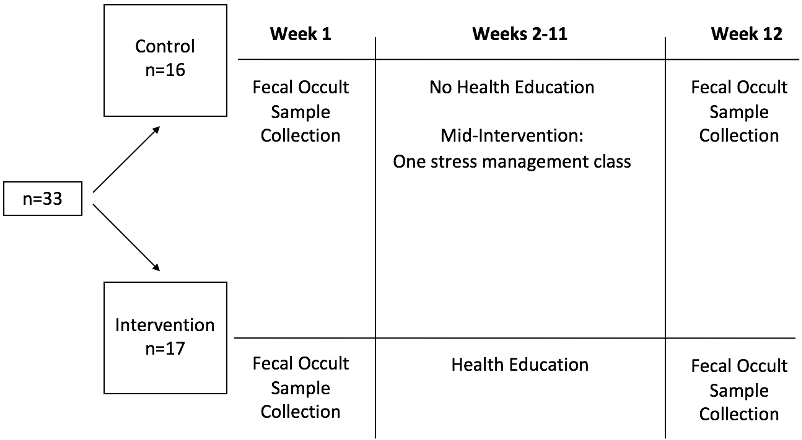
Data collected at baseline (week 1) and after the termination of the Health education (week 12) for the control and intervention groups
This secondary analysis focused on the microbiota aspect of the FPD Study, a randomized controlled, clinical trial conducted at Loma Linda University, CA, USA. The design, methods and primary objectives of the FPD trial have been described by Dos Santos, Beeson, Segovia-Siapco, Koranda and Jehi 22. In brief, a 10-week health education program that placed emphasis on improving physical activity level and diet quality was conducted to determine its impact on body weight and on various clinical variables. Subjects were included if they were 21 to 65 years old, had a body mass index (BMI) between 25 and 35 kg/m2, did not have a debilitating disease, and had not previously participated in the Full Plate Diet program. Then, the participants were randomly assigned to either a health education intervention group or to a control group (receiving one stress management class).
In the current secondary analysis, we particularly focused on assessing the effect of health education on microbiota abundance and diversity. As displayed in Figure 1, fecal occult samples were collected for both groups at baseline (week 1; between April 1 and 8 of 2018) and after the termination of the intervention (week 12; June 17 – 24). The health education intervention was conducted from week 2 to week 11.
The original study protocol was approved by the Institutional Review Board at Loma Linda University (LLU-IRB # 5170138). All participants provided a written informed consent before enrolling in the study.
The health education intervention is described by Dos Santos, Beeson, Segovia-Siapco, Koranda and Jehi 22. In brief, it was conducted through educational classes once a week for 10 weeks at the Loma Linda University Drayson Center, a wellness center that promotes physical, emotional, and social wholeness through various sports, fitness activities and health programs. The main goal was to help participants adopt the Full Plate Diet by improving their diet quality and increasing their intake of fruits, vegetables, and whole grains. The intervention consisted of a nutrition course provided through 10 two-hour lectures. The health education did not place emphasis on the restriction of calorie intake. It was mainly focused on the importance and the means to enhance nutrient density by increasing dietary fiber intake and on the promotion of various lifestyle modification tools such as physical activity, stress management, and emotional eating.
Anthropometric & clinical evaluations The complete data collection protocols of the original study are described elsewhere 22.
Fecal sample collection Fecal samples were collected (Immunostics; Hema-screen) at baseline and after the termination of the health education intervention, stored at -80 Co at the School of Public Health, Loma Linda University, and kept frozen until further processing. To conduct the analysis of the microbiota, the occult samples were shipped as a single batch to the appropriate laboratory for the analysis of the microbiota.
DNA extraction, 16S V4 ribosomal RNA (rRNA) gene amplicon sequencing and microbiome data processing Bacterial DNA was extracted and 16S rRNA amplicon were sequenced by Microbiome Insights Inc. (Vancouver, BC, Canada). In brief, specimens were placed into a MoBio PowerMag Soil DNA Isolation Bead plate and were extracted following MoBio’s instructions on a KingFisher robot (Mo Bio Laboratories, Inc., Indiana, USA). Bacterial 16S rRNA genes were PCR-amplified with dual-barcoded primers set (515F /806R) targeting the V4 region (5’-GTGCCAGCMGCCGCGGTAA-3’, and 5’-GGACTACHVGGGTWTCTAAT-3’), based on the protocol by Kozich, Westcott, Baxter, Highlander and Schloss 23. Amplicons were purified, normalized using a SequalPrep kit (Invitrogen, Eugene, OR), then quantitated with a Qubit 2.0 flourometer to be prepared for illumine sequencing. Amplicons were sequenced with an Illumina MiSeq using the 300-bp paired-end kit (v.3). The potential for contamination was addressed by co-sequencing DNA amplified from the specimen’s template-free controls (negative control) and extraction kit reagents. A positive control consisting of cloned SUP05 DNA was also included. An OTU was considered putative contaminant and removed if its mean abundance in the controls reached or exceeded 25 % of its abundance in the specimens.
Raw sequences were first merged, aligned and pre-clustered using a 2-nucleotide threshold 24. De novo chimera detection was done with the abundance-based algorithm implemented in UCHIME 25. Then, reads were denoised and clustered into 97%-similarity operational taxonomic units (OTUs) against the Silva (v. 138) database by the Mothur software package (v. 1.44.1) 26 following the recommended procedure by Mothur 27.
Samples which had a lower minimum sequences depth (3000) were discarded. Subjects who had viable sequencing data for both ‘before’ and ‘after’ intervention were exclusively included in the statistical analyses. OTUs not seen more than 10 times in at least 15% of total number of samples were removed. This approach resulted in 17 subjects in the intervention group, 16 subjects in the control group, and a total of 260 OTUs which were used in downstream analyses and accounted for 98.8% of the approximately 2.8 million-curated reads.
Before ordination and statistical analysis, OTU count data were transformed into relative abundance and centered-log ratio (CLR) data to account for compositionality 28 using microbiome package (Leo Lahti et al. microbiome R package. URL: http://microbiome.github.iowith). Finally, all OTUs, taxonomic and meta data, were imported into R studio platform (v1.2.5033 © 2009-2019 Rstudio, Inc.), programed by R language (v3.5.3) 29 and managed by phyloseq package 30.
All univariate and multivariate analyses were performed using R studio. Data were presented as mean ± SD of relative abundance; CLR data were served as an input for statistical tests unless otherwise stated.
Bacterial community analysis To explore the impact of health education on the bacterial community, α-diversity and β-diversity were assessed. To estimate the dissimilarity of entire bacterial community of one sample to another (β-diversity), Bray-Curtis distance was calculated from relative abundance data of all OTUs and stored in a matrix form. Then, it was collapsed into 3 vectors of Principal Coordinate Analysis (PCoA1; PCoA2; PCoA3) using the vegan package 31 and visualized in a 3-D plot using rgl package following the general procedure described by Daniel Alder. Variation in community structure was assessed with permutational multivariate analysis of variance (PERMANOVA; vegan package) with the treatment group and time points as the main factors. To evaluate the richness, evenness and phylogenetic diversity (PD) within each sample, 3 indices of α-diversity, Observed Species, Shannon Diversity Index, and PD were employed using phyloseq and ape package v 5.4.1 32 and were visualized by ggplot2 package 33. Linear mixed models were applied using lme4 package 34 to estimate the effect of the intervention and time point on α-diversity while controlling for the within subject difference.
Fecal bacterial composition analyses Comparisons of phyla, families, genera, and OTUs, between baseline and week 10, were performed by Wilcoxon tests, while comparisons of time changes (i.e., Δ week10- baseline) between intervention and control groups were performed by Mann–Whitney tests. CLR data were used as an input for both tests. For the OTUs’ level, only the top 100 selected based on the average relative abundance of all samples were included in abundance testing. P values were adjusted by false discovery rate (FDR) and were considered statistically significant when adjusted values were less than 0.1. These comparisons were validated by an independent approach which used generalized linear model from Deseq2 package 35. Taxa were considered significant when adjusted p value (Deseq2) were less than 0.1 and log2 fold change exceeded 2. The significant taxa detected by both tests were considered statistically different.
Sample Size Estimation To estimate the sample size, an effect size of 0.64 was attained from literature and derived from So, Whelan, Rossi, Morrison, Holtmann, Kelly, Shanahan, Staudacher and Campbell 19 to compute and compare the differences in the changes of the abundance of Bifidobacterium spp. from baseline to post-intervention between the control and intervention groups that are of clinical importance. G*Power 3.1 (3.1.9.2) was utilized for the power analysis calculations taking into account 80% power and allowing for a type I (α) error of 5%. This study needed a minimum of 6 subjects/per group or a total sample of 16 subjects after taking into account a potential 20% drop- out rate. Data on 33 subjects of the main FPD study (16 in the control and 17 in the intervention) were available and showed enough power (>80%) for the current secondary analysis.
The characteristics of the participants have been previously published by Jehi, Beeson, Segovia-Siapco, Koranda and Dos Santos 21 and by Dos Santos, Beeson, Segovia-Siapco, Koranda and Jehi 22. In brief, the average age was 53.4 ± 8.8 and 53.8 ± 11.6 years for the control and intervention groups, respectively. The baseline weight was 82.3 ± 16.8 kgs and 86 ± 14 kgs for the control and intervention groups, respectively. The majority of the population at baseline were females, overweight, non-smokers, employed for wages, had a 4-year college degree, did not consume alcohol, and did not have any other cardiovascular disease risk factors.
Figure 2. Box Plots Comparing the α-Diversity between the Intervention and Control Group (N=33)
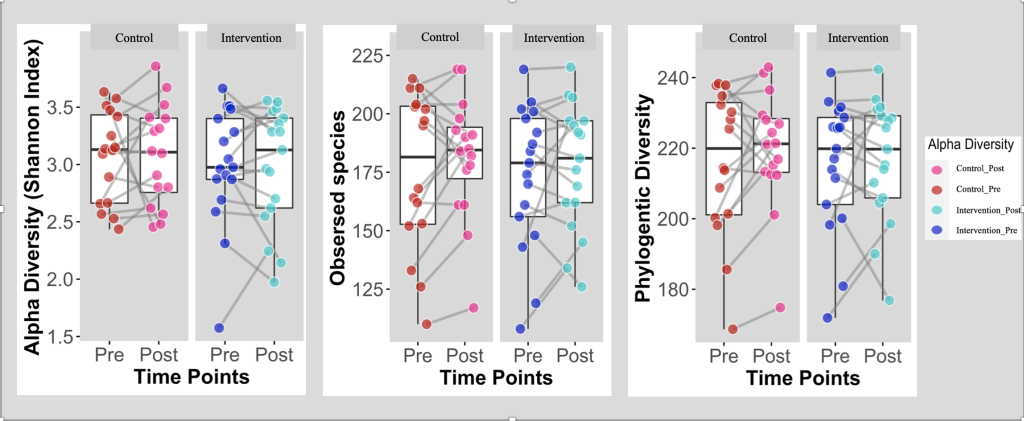
Box Plots comparing α-diversity between Intervention (Health Education) and Control groups at baseline (Pre) and post the intervention (post); Intervention group (n = 17); Control group (n=16).
α-diversity defines the richness and evenness of the gut microbiota’s composition 36,37. Shannon diversity index is a statistic index utilized to characterize the bacterial community’s α-diversity and has been computed and illustrated for the 2 groups at baseline and post-intervention. The α-diversity of the observed species along with PD (the degree of divergence among the sampled sequences 38) were computed as well. As displayed in figure 2, the box plots showed that there are no significant differences in the α-diversity between baseline and post-intervention for both groups.
Figure 3. PCoA Plot of Bray-Curtis Dissimilarity
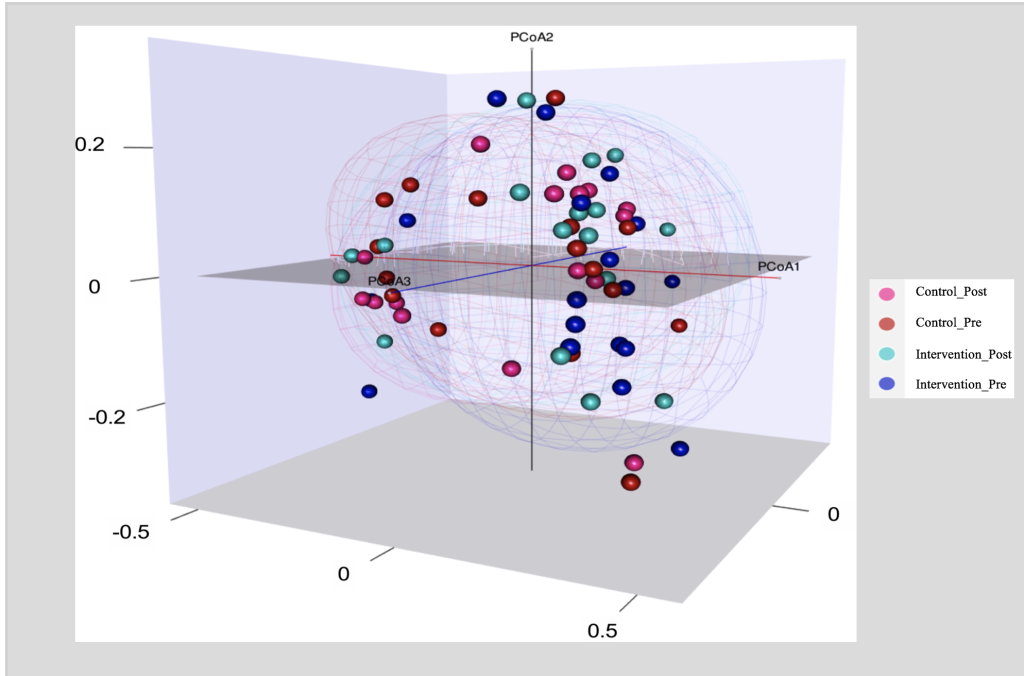
PCoA Plot of Bray-Curtis Dissimilarity to compare ß-diversity between Intervention (Health Education) and Control groups at baseline (Pre) and post the health education intervention (post); Intervention group (n = 17); Control group (n=16).
ß diversity measures the differences between microbial communities from different environments. To obtain a graphical representation of microbiome composition similarity among samples and to quantify the compositional dissimilarity, we summarized OTU abundances into Bray-Curtis dissimilarities and performed a PCOA ordination (figure 3). The Bray-Curtis dissimilarities are based on the relative abundance of the different bacterial taxa. Figure 3 displays 2 main clusters, one on the left side and one on the right. The overlapping clusters are a direct indication that the bacterial communities did not differ among groups (P value for time X Group = 0.99).
Table.1 Abundance of Bacterial Groups at Baseline and Post-Treatment for Participants of the FPD Trial (N=33)
Taxonomic Ranks | Control Group | Intervention Group | P Valuec | |||||||
| Phyla | Families | Genera | Baseline Mean ± SD | Post-treatment Mean ± SD | P Valuea | Baseline Mean ± SD | Post-treatment Mean ± SD | P Valueb |
|
OTU | ||||||||||
OTU00001 | Bacteroidota | Bacteroidaceae | Bacteroides | 0.135 ± 0.122 | 0.121 ± 0.081 | 0.979 | 0.169 ± 0.123 | 0.134 ± 0.123 | 0.675 | 0.979 |
OTU00002 | Bacteroidota | Prevotellaceae | Prevotella | 0.155 ± 0.200 | 0.160 ± 0.223 | 0.979 | 0.089 ± 0.209 | 0.117 ± 0.218 | 0.919 | 0.979 |
OTU00003 | Firmicutes | Ruminococcaceae | Faecalibacterium | 0.096 ± 0.042 | 0.107 ± 0.072 | 0.979 | 0.077 ± 0.047 | 0.087 ± 0.052 | 0.675 | 0.979 |
OTU00011 | Firmicutes | Lachnospiraceae | Roseburia | 0.044 ± 0.032 | 0.040 ± 0.024 | 0.979 | 0.060 ± 0.064 | 0.081 ± 0.088 | 0.696 | 0.979 |
OTU00008 | Firmicutes | Lachnospiraceae | Bacteroides | 0.032 ± 0.042 | 0.034 ± 0.049 | 0.979 | 0.053 ± 0.057 | 0.030 ± 0.034 | 0.521 | 0.979 |
OTU00005 | Firmicutes | Lachnospiraceae | Bacteroides | 0.024 ± 0.033 | 0.012 ± 0.018 | 0.979 | 0.035 ± 0.058 | 0.024 ± 0.038 | 0.521 | 0.979 |
OTU00013 | Bacteroidota | Prevotellaceae | Blautia | 0.024 ± 0.025 | 0.017 ± 0.014 | 0.779 | 0.020 ± 0.015 | 0.023 ± 0.020 | 0.993 | 0.779 |
OTU00010 | Actinobacteriota | Bifidobacteriaceae | Bifidobacterium | 0.011 ± 0.019 | 0.007 ± 0.011 | 0.979 | 0.023 ± 0.038 | 0.027 ± 0.034 | 0.762 | 0.979 |
OTU00014 | Firmicutes | Ruminococcaceae | Prevotellaceae | 0.003 ± 0.008 | 0.005 ± 0.013 | 0.979 | 0.030 ± 0.089 | 0.028 ± 0.079 | 0.544 | 0.979 |
Genus00041 | Bacteroidota | Rikenellaceae | Lachnospiraceae | 0.014 ± 0.014 | 0.016 ± 0.016 | 0.979 | 0.013 ± 0.013 | 0.019 ± 0.027 | 0.696 | 0.979 |
Genus00079 | Firmicutes | Clostridia_unclassified | CAG-352 | 0.006 ± 0.008 | 0.012 ± 0.016 | 0.979 | 0.021 ± 0.022 | 0.020 ± 0.026 | 0.696 | 0.979 |
Genus00021 | Firmicutes | Erysipelatoclostridiaceae | Lachnospiraceae | 0.017 ± 0.029 | 0.016 ± 0.016 | 0.979 | 0.012 ± 0.014 | 0.009 ± 0.010 | 0.999 | 0.979 |
Genus00023 | Firmicutes | Erysipelatoclostridiaceae | Faecalibacterium | 0.011 ± 0.010 | 0.012 ± 0.013 | 0.979 | 0.015 ± 0.022 | 0.015 ± 0.018 | 0.638 | 0.979 |
Genus00039 | Firmicutes | Oscillospiraceae | Bacteroides | 0.015 ± 0.039 | 0.025 ± 0.083 | 0.979 | 0.010 ± 0.030 | 0.004 ± 0.013 | 0.544 | 0.979 |
Genus00048 | Firmicutes | Acidaminococcaceae | Blautia | 0.015 ± 0.017 | 0.013 ± 0.011 | 0.979 | 0.008 ± 0.005 | 0.015 ± 0.014 | 0.521 | 0.979 |
Genera | ||||||||||
Genus00001 | Bacteroidota | Bacteroidaceae | Bacteroides | 0.294 ± 0.223 | 0.260 ± 0.173 | 0.833 | 0.346 ± 0.210 | 0.254 ± 0.175 | 0.974 | 0.833 |
Genus00002 | Bacteroidota | Prevotellaceae | Prevotella | 0.173 ±0.221 | 0.175 ± 0.246 | 0.869 | 0.096 ± 0.223 | 0.133 ± 0.250 | 0.989 | 0.869 |
Genus00003 | Firmicutes | Ruminococcaceae | Faecalibacterium | 0.134 ± 0.062 | 0.150 ± 0.098 | 0.900 | 0.113 ± 0.066 | 0.126 ± 0.052 | 0.974 | 0.900 |
Genus00011 | Firmicutes | Lachnospiraceae | Roseburia | 0.090 ± 0.072 | 0.094 ± 0.055 | 0.869 | 0.083 ± 0.039 | 0.085 ± 0.038 | 0.990 | 0.869 |
Genus00008 | Firmicutes | Lachnospiraceae | Bacteroides | 0.075 ± 0.036 | 0.070 ± 0.039 | 0.794 | 0.055 ± 0.026 | 0.066 ± 0.031 | 0.989 | 0.794 |
Genus00005 | Firmicutes | Lachnospiraceae | Bacteroides | 0.050 ± 0.034 | 0.049 ± 0.024 | 0.974 | 0.069 ± 0.064 | 0.091 ± 0.090 | 0.989 | 0.974 |
Genus00013 | Bacteroidota | Prevotellaceae | Blautia | 0.010 ± 0.025 | 0.013 ± 0.026 | 0.869 | 0.034 ± 0.092 | 0.033 ± 0.080 | 0.974 | 0.869 |
Genus00010 | Actinobacteriota | Bifidobacteriaceae | Bifidobacterium | 0.012 ± 0.022 | 0.008 ± 0.011 | 0.871 | 0.025 ± 0.038 | 0.028 ± 0.035 | 0.989 | 0.871 |
Genus00014 | Firmicutes | Ruminococcaceae | Prevotellaceae | 0.006 ± 0.008 | 0.012 ± 0.012 | 0.869 | 0.021 ± 0.022 | 0.020 ± 0.026 | 0.974 | 0.869 |
Genus00041 | Bacteroidota | Rikenellaceae | Lachnospiraceae | 0.018 ± 0.022 | 0.017 ± 0.025 | 0.871 | 0.011 ± 0.013 | 0.010 ± 0.010 | 0.989 | 0.871 |
Genus00079 | Firmicutes | Clostridia_unclassified | CAG-352 | 0.014 ± 0.010 | 0.013 ± 0.010 | 0.833 | 0.011 ± 0.011 | 0.010 ± 0.009 | 0.974 | 0.833 |
Genus00021 | Firmicutes | Erysipelatoclostridiaceae | Lachnospiraceae | 0.012 ± 0.023 | 0.014 ± 0.030 | 0.833 | 0.007 ± 0.015 | 0.012 ± 0.030 | 0.974 | 0.833 |
Genus00023 | Firmicutes | Erysipelatoclostridiaceae | Faecalibacterium | 0.006 ± 0.007 | 0.020 ± 0.027 | 0.233 | 0.007 ± 0.011 | 0.009 ± 0.012 | 0.999 | 0.233 |
Genus00039 | Firmicutes | Oscillospiraceae | Bacteroides | 0.008 ± 0.010 | 0.012 ± 0.015 | 0.871 | 0.005 ± 0.009 | 0.005 ± 0.007 | 0.974 | 0.871 |
Genus00048 | Firmicutes | Acidaminococcaceae | Blautia | 0.010 ± 0.015 | 0.008 ± 0.010 | 0.100 | 0.007 ± 0.008 | 0.007 ± 0.008 | 0.989 | 0.999 |
SD, standard deviation
Data displayed as mean of proportion ± SD
P values > 0.01 denotes statistical significance
a P-value generated by Wilcoxon test to assess significance level of change between baseline and post-treatment in the control group
b P-value generated by Wilcoxon test to assess significance level of change between baseline and post-treatment in the intervention (Health education) group
The abundance of different microbial taxa was also measured for both groups and compared between baseline and post-intervention. Table 1 displays the top 15 most abundant bacterial taxa for the different levels (OTU and Genera). The values presented in the table are proportions and not the actual quantities of the bacteria. As shown in table 1, there were no significant changes in the abundance of any of the bacterial taxa between baseline and post-intervention and no significant differences between the control and the intervention groups (P values > 0.01).
Figure 4: Predicting the Shift in Microbiome Between Baseline and Post-Intervention
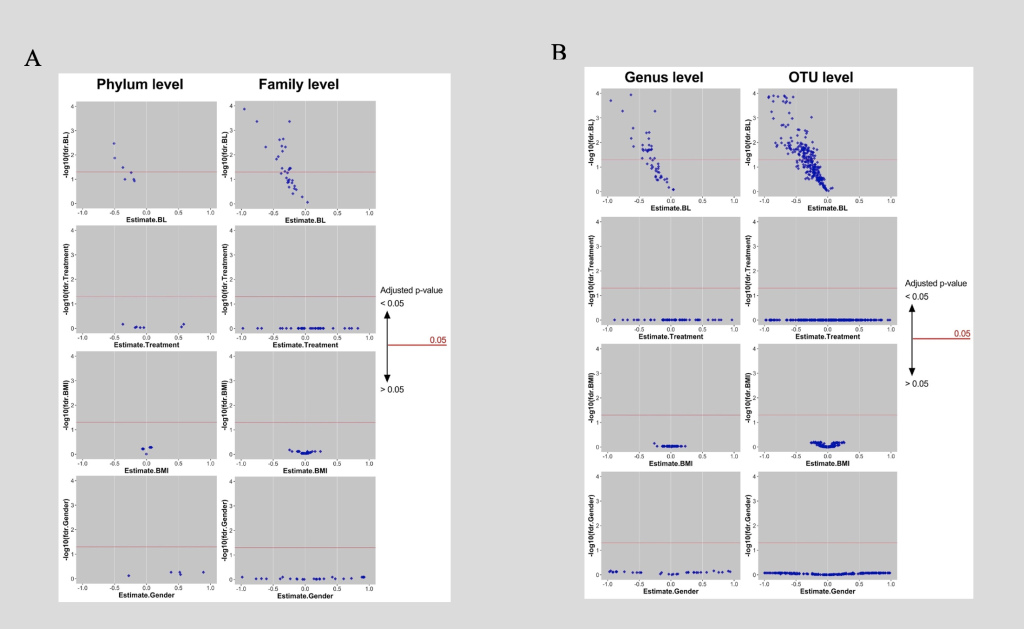
A: Phyla and families of which baseline can determine shift significantly, surge above red line where adjusted p-value is smaller 0.05. Coordinate of each diamond are adjusted p-value (-log10) and the coefficient of 4 main predictors (baseline microbiome, treatments [Health Education; Control], baseline BMI and gender) of a multiple linear regression. B: Genera and OTUs of which baseline can determine shift significantly, surge above red line where adjusted p-value is smaller 0.05. Coordinate of each diamond are adjusted p-value (-log10) and the coefficient of 4 main predictors (baseline microbiome, treatments [Health Education; Control], baseline BMI and gender) of a multiple linear regression.
In order to better understand what intrinsic and extrinsic factors affect the responses of individual microbiota taxa to the intervention at different levels, a multilinear regression was conducted (figure 4).
As displayed in figure 4, four different predictors were examined; the first was the baseline of the microbiome; the second was the type of treatment (intervention vs. control); the third was the baseline BMI of the subjects; and the fourth was gender. In parts A and B of figure 4, the X axis represented the estimates or coefficients of the factors and the Y axis was the -log10 of adjusted P values. Every dot in this figure represented a particular taxon. As displayed in part A, taxa at the phylum and family levels were examined; taxa at the genus and the OTU levels were presented in part B. Out of all 4 factors, the baseline microbiome significantly determined the shift of the microbiome from baseline to post-intervention. Around half of the taxa surged above the red line signifying that baseline level could have significantly (P values < 0.05) determined the shift in microbiome; this was consistent across all the levels (phylum, family, genus, and OTU). Intervention type, gender, and baseline BMI did not predict the change of microbiome.
Figure 5. Baseline Microbiome and the Shift in Microbiome Between Baseline and post-Intervention
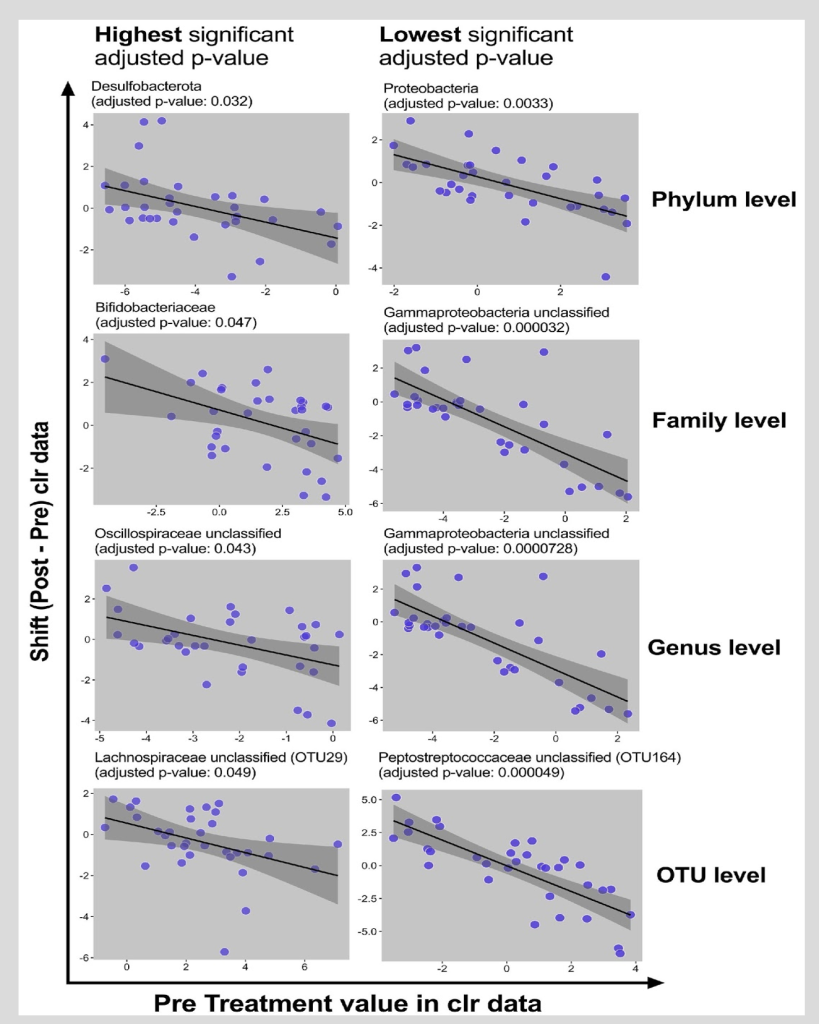
Visualization of associations between baseline value and shifts (clr data) in particular taxa at different levels. Each dot represents baseline and shift of a subject in particular taxa. Black line is the regression line covered by 95% CI dark grey area.
Figure 5 focused on the baseline microbiome factor and displayed the direction of the microbiome response; the associations between the baseline value and the shifts in particular taxa at different levels were displayed. Each dot represented baseline and the shift of a subject in a particular taxon. The black line is the regression line covered by 95% CI dark grey area. The taxa with highest significant adjusted P value and the lowest significant adjusted P value were presented. As displayed in the figure, there was a decrease in the abundance of the bacterial taxa for individuals with high baseline levels; there was an increase in the abundance of the bacterial taxa for those with low baseline levels. Additionally, data were proximal to the regression line within the shaded region which signifies strong findings. Finally, the slope and the direction of the change were negative.
Health education is a non-invasive and cost-effective intervention approach to improve the wellbeing of the community 39. We attempted to identify whether the observed benefits of health education in epidemiological studies could be explained by the modulation of the microbiome. We showed that a health education program that emphasized improvement in diet quality, physical activity, and stress management did not have a significant impact on the abundance and the diversity of the microbiota in a group of overweight middle-aged individuals. After examining a variety of intrinsic and extrinsic factors, we observed that the treatment type, gender, and baseline BMI, did not predict the change of individual microbiota taxa from baseline to post-intervention. Baseline microbiome level, however, did significantly determine the shift of the individual microbiota taxa.
Not much research has been conducted to investigate the effect of a lifestyle health education program on the microbiome; most of the existing investigations did not focus exclusively on education but also incorporated direct and intensive lifestyle interventions 40-44. When it comes to the diet, most existing studies examined the effect dietary fiber on the microbiome and showed little to no effect on both the α- 40-43 and the ß- 41,42 diversities. The lack of significant changes in the diversity could be possibly explained by the relative stability of the microbiome over time 42 and the short-term dietary interventions which are unlikely to modify the diversity of the gut microbiota 19. As for the abundance of various individual bacterial taxa, research mostly suggested that whole food intervention such as whole grains, had little to no effect 45-49. Interventions delivered through supplements, specifically fiber, on the other hand, were shown to significantly improve the abundance of Bifidobacterium sp. and Lactobacillus spp 50-53 but had no effect on the abundance of other bacterial groups such as of Bacteroides 54, Roseburia 52,55,56, Ruminococcaceae 51,57,58, and Faecalibacterium 51,52,59,60. These species can possibly be stimulated by other dietary components such as polyols and polyphenols 61 rather than fiber.
It is important to understand what factors might have predicted the gut microbiome’s response to different lifestyle education interventions. For instance, research has shown that a variety of intrinsic and extrinsic variables 50,62,63 such as body weight 64 and gender 65,66 can possibly affect the responsiveness of the bacteria to various dietary interventions. Our findings, however, indicated that neither gender nor baseline BMI predicts this responsiveness. We did find that the baseline microbiome level influences the shift in the individual microbiota taxa from baseline to post-intervention. Tuohy, Finlay, Wynne and Gibson 62 suggested that individuals who had lower bifidobacteria concentrations at baseline experienced a more significant increase in bifidobacteria after the inulin intervention. Moreover, an investigation involving a group of healthy individuals showed that the intake of fructo-oligosaccharides and guar gum –rich biscuits improved bifidobacteria growth only in subjects with a baseline bifidobacteria concentration lower than 9.3 log10 cells/g 67.
Our study has various strengths as it is one of few that investigated the effect of health education, exclusively, on the diversity and abundance of the microbiota in a group of healthy overweight individuals; most studies in literature emphasized the role of more aggressive and costly interventions on the microbiota abundance 19. Our study broadened the scope of other investigations and included a wide list of bacterial groups rather than focusing mainly on Bifidobacterium sp. and Lactobacillus spp 50-53. We also investigated a variety of intrinsic and extrinsic factors, highlighting baseline microbiome’s role of influencing the response of individual microbiota taxa to the health education intervention.
The study, however, has limitations including the analyses of the microbial composition of feces to investigate the effect of health education intervention on gut microbiota profiles; the mucosal microbiota might differ from the microbial composition of feces 68,69. Secondly, our intervention was of short-duration; 10 weeks might not have been enough to cause major improvements in the gut microbiota 19 and thus, longer-duration studies are required to better understand the chronic effect of fiber on microbiota diversity and abundance. Moreover, the study might have been impacted by selection bias since the participants volunteered to participate 70. The inclusion of healthy volunteers and exclusion of individuals with debilitating diseases could have threatened the generalizability of the findings. We also were not able to analyze the level of short chain fatty acids, the major bacterial fermentative end products of complex carbohydrates and imperative indicators of bacterial fermentation in the colon 71 as they are usually degraded in the occult samples. Finally, our small sample size might have led to type 2 error and undermined the internal and external validity of the study72. Future studies with larger sample sizes are thus required to increase statistical power.
Future investigations should aim to further assess the influence of different factors on the gut microbiota and on the host responsiveness to diet in order to develop effective gut microbiota and host outcome modulation strategies. More studies are also required to comprehend the impact of the long-term habitual fiber intake from whole foods on the gut microbiota. This is crucial since the microbiota in-return play a crucial role in chronic disease prevention. Future research should aim to understand the main function of these bacteria in modifying the risk of various chronic diseases among racial, ethnic, religious, disability, gender, and sexual minorities. These populations are at high risk of disease morbidity and mortality 73,74. By increasing opportunities for everyone to live the healthiest life possible and prevent disease, health equity will be achieved.
A health education program that emphasized improvement in diet quality, physical activity, and stress management did not have a significant impact on the abundance and the diversity of the microbiota in a group of overweight middle-aged individuals. The shift in the microbiome, however, and the responsiveness to the education intervention could be predicted by the baseline microbiome level. Future studies should further investigate the long-term impact of health education on the microbiome along with the influence of a variety of intrinsic and extrinsic variables that can affect the responsiveness of the microbiota to this intervention.
This trial was funded by the Ardmore Institute of Health.
The author(s) have no relevant financial disclosures or conflicts of interest.
Study data can be accessed by requesting the study PI, Dr. Hildemar Dos Santos (hdossantos@llu.edu).
Dr. Tony Jehi is an assistant professor at California State University Dominguez Hills. He has been an advocate for community wellness and has been heavily invested in community research for the past decade. He has worked at various academic and public health settings to support underserved populations and help them modify their lifestyles and manage chronic diseases. Dr. Jehi was a Research Analyst at Loma Linda University office of Preventive Care and attained grants, designed and implemented clinical trials, and translated research findings to community action. For 3 years, Dr. Jehi supported other professionals in their research studies at James Madison University to not only attain funding, but also to perform data collection, data management, advanced statistical analyses, and manuscript development.
Dr. Hildemar Dos Santos is a professor and the director of the Preventive Care DrPH Program at Loma Linda University. His main mission has been to conduct research focused on community wellness and to train professionals to go to the community and help people to change their lifestyles, especially destructive lifestyles such as smoking, drinking, physical inactivity, stress, and unhealthy diets.
HPHR.org was designed by ComputerAlly.com.
Visit HPHR’s publisher, the Boston Congress of Public Health (BCPH).
Email communications@bcph.org for more information.
Click below to make a tax-deductible donation supporting the educational initiatives of the Boston Congress of Public Health, publisher of HPHR Journal.![]()