Kaufman M, Petchel S. Underinsurance among privately insured US children: findings from the national survey of children’s health 2020. HPHR. 2023.54. 10.54111/0001/BBB8
30% of children in the United States (US) lack continuous health insurance coverage or their insurance does not cover needed services at a cost their family can afford and are considered ‘underinsured.’ Prior research found that privately insured children are more likely to be underinsured but research is limited on the role of income and Medicaid eligibility across insurance types. Our objective was to describe underinsurance by payer, income, and state-specific Medicaid eligibility limits to demonstrate the need to examine underinsurance at the intersection of these three factors.
We utilized the National Survey of Children’s Health (NSCH) from 2020 to describe underinsurance and the drivers of underinsurance by payer. Further, we described underinsurance by household income and state-specific eligibility for Medicaid or the Children’s Health Insurance Program (CHIP) by payer. All analyses utilized a complex survey design.
In 2020, 33.1% (Standard Error (SE): 0.6%) of privately insured children were underinsured, which amounts to approximately 13,740,273 US children. In contrast, only 14.9% (SE: 0.9) of children with public insurance reported being underinsured. Further, privately insured children in households with incomes that may be Medicaid/CHIP eligible experienced underinsurance at a level over twice as high as those with public insurance (37.5%, SE: 1.2% vs. 14.6, SE: 0.9%).
Our findings show that underinsurance among children disproportionately impacts the privately insured, which accounts for 60% of all US children, particularly those that may be eligible for public insurance.
Approximately 30% of US children are ‘underinsured,’1 lacking affordable or continuous health insurance.2 Underinsurance is most prevalent among children with private insurance or who live in households with incomes between 200-399% of the Federal Poverty Level (FPL).1,3,4 The primary driver of underinsurance is out-of-pocket (OOP) costs (i.e., direct costs one pays for care on top of premiums such as copayments, deductibles, and coinsurance).5 Among children at 200-399% of FPL , those with Medicaid or the Children’s Health Insurance Program (CHIP) are less likely than privately insured children to be underinsured because coverage is provided without OOP costs).1,3,6
While national estimates of child underinsurance are helpful in guiding federal policy, state-level estimates may be more useful to policymakers because Medicaid/CHIP eligibility varies by state, with household income limits ranging from 175 to 405% of FPL.7 This analysis described in-progress research on the role of Medicaid in closing gaps in child underinsurance. We described underinsurance stratified by payer, income, and state-specific Medicaid/CHIP eligibility to demonstrate the need to examine underinsurance at the intersection of these three factors.
We utilized the National Survey of Children’s Health (NSCH), a nationally representative survey of children’s health and health determinants , from 2020.8 Our study sample excluded children with co-occurring public and private insurance, or those who were currently uninsured. Underinsurance was operationalized using a previously published four-part definition2: the child had a gap in coverage during the past 12 months; insurance benefits sometimes or never met the child’s needs; insurance coverage sometimes or never allowed children to see needed providers; and insurance out-of-pocket expenses were sometimes or never reasonable.
In addition, we assessed insurance type (public or private) and household income as a percent of FPL (0-199%, 200-299%, 300-399%, 400%+). We assessed the state-specific maximum income limit for children with Medicaid/CHIP7 and created a categorical variable based on Medicaid/CHIP eligibility: 1) at or below the Medicaid/CHIP income eligibility limit for the state, 2) above Medicaid/CHIP income eligibility limit and with household income below 400% FPL, and 3) household income above 400% FPL.
Our analyses incorporated complex survey design variables to describe the reason for underinsurance by insurance type, as well as underinsurance prevalence by household FPL and Medicaid/CHIP eligibility stratified by insurance type. All counts and percentages incorporated survey design variables and were weighted to represent the US child population. All analyses were conducted using SAS 9.4 statistical software.
In 2020, one in three privately insured children in the US were underinsured (33.1%, SE: 0.6; weighted N = 13,740,273). In contrast, only 14.9% (SE: 0.9; weighted N = 3,139,617) of children with Medicaid or CHIP were underinsured. The primary reason for underinsurance for the privately insured was the cost of care, with 31.3% (SE: 0.6) reporting that OOP expenses were sometimes or never reasonable (Figure 1).
Figure 1. Reason for Underinsurance by Insurance Type, National Survey of Children’s Health 2020 (Survey Weighted N = 71,204,933)
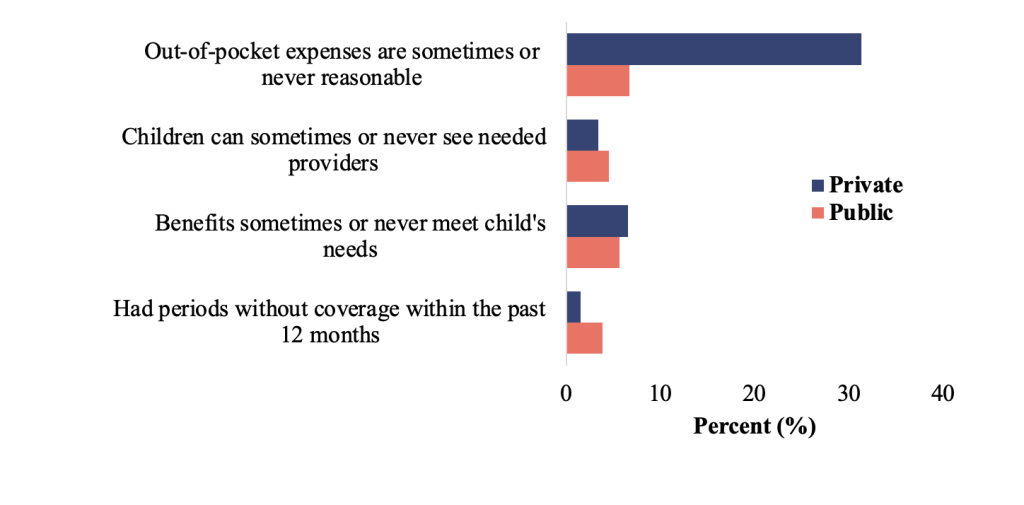
Note: Each measure is not mutually exclusive.
Among the privately insured, we found that underinsurance increased as household income as a percentage of FPL decreased. The highest rate of underinsurance among privately insured children was among households below 200% of FPL (39.6%, SE: 1.5), compared to only 14.9% (SE: 0.9) among publicly insured children in households at the same income levels (Table 1). Children with private insurance who may be Medicaid/CHIP eligible experienced underinsurance at a level twice as high as their counterparts with public insurance (37.5%, SE: 1.2 vs. 14.6, SE: 0.9).
Table 1. Underinsurance Prevalence by Household Income as a Percentage of Federal Poverty Level (FPL), Medicaid/CHIP Eligibility, and Insurance Type, National Survey of Children’s Health 2020
Public | Private | Overall | |
Weighted N = 21,057,073 | Weighted N = 41,472,783 | Weighted N = 71,204,933 | |
| % (SE) | % (SE) | % (SE) |
Household income as a % of FPL based on State Children’s Health Insurance Program groups | |||
0-199% | 14.5 (1.0) | 39.6 (1.5) | 30.6 (0.9) |
200-299% | 14.5 (1.6) | 37.5 (1.7) | 36.2 (1.3) |
300-399% | 20.6 (6.0) | 34.6 (1.4) | 37.8 (1.4) |
400%+ | 18.2 (3.0) | 28.9 (0.7) | 31.1 (0.7) |
Medicaid/CHIP Eligibility | |||
At or below the Medicaid/CHIP income eligibility limit | 14.6 (0.9) | 37.5 (1.2) | 31.3 (0.8) |
Above Medicaid/CHIP income eligibility limit and with household income below 400% FPL | 16.2 (3.2) | 36.9 (1.3) | 38.5 (1.2) |
Household income above 400% FPL | 18.2 (3.0) | 28.9 (0.7) | 31.1 (0.7) |
Abbreviations: SE standard error; FPL federal poverty level; CHIP Children’s Health Insurance Program
Note: All counts, percentage, and standard errors incorporate survey weights and complex design variables.
Our findings demonstrate that underinsurance, driven by OOP expenses, disproportionately impacts privately insured children (approximately 60% of US children). We found the highest rates of underinsurance among children with household incomes below 200% of FPL, many of whom may be eligible for Medicaid or CHIP.
Our study was subject to limitations. First, the data rely on parent recall of children’s health insurance cost and access, which may be biased. Second, we approximated Medicaid/CHIP eligibility based on the maximum income limit within each state, which could overestimate the number of eligible children. Finally, while cost, access, and coverage can change over time, we used cross-sectional data capturing a single snapshot in time.
Overall, our findings highlight the need for continued research on underinsurance to inform state and national policymaking. Our results suggest meaningful opportunities exist to reduce child underinsurance by ensuring eligible children are enrolled in public coverage, particularly at household income levels where eligibility for Medicaid may vary between adult and child household members. States exploring opportunities to expand coverage through, for example, Section 1332 State Innovation Waivers, should also consider the impact of OOP costs when designing coverage for lower income households.
We deeply appreciate the time, patience, and editing from Ann Martinez Acevedo, MPH.
The authors have no relevant financial disclosures or conflicts of interest.
Dr. Kaufman is a senior research associate at the Center for Health Systems Effectiveness at Oregon Health & Science University. Her research interests include postpartum health, health insurance, health care finance, and Medicaid policy. She holds a doctorate in epidemiology from the Oregon Health & Science University-Portland State University School of Public Health.
Dr. Petchel is a senior legislative analyst with the Oregon Legislative Policy & Research Office and an adjunct professor at Portland State University. She holds a doctorate in health systems and policy from the Oregon Health & Science University-Portland State University School of Public Health.
HPHR.org was designed by ComputerAlly.com.
Visit HPHR’s publisher, the Boston Congress of Public Health (BCPH).
Email communications@bcph.org for more information.
Click below to make a tax-deductible donation supporting the educational initiatives of the Boston Congress of Public Health, publisher of HPHR Journal.![]()