Kim H, Murro R, Park J, Kim Y, Kim Y, Lee P, Koh H, Diamond-Smith N. Trends of sex ratio at birth and its association with sociodemographic factors among Asian American subgroups in the US from 2016 to 2021. HPHR. 2023;52. https://doi.org/10.54111/0001/ZZ7
Concerns about stigmatization and barriers to access to reproductive health among Asian American women have been raised.
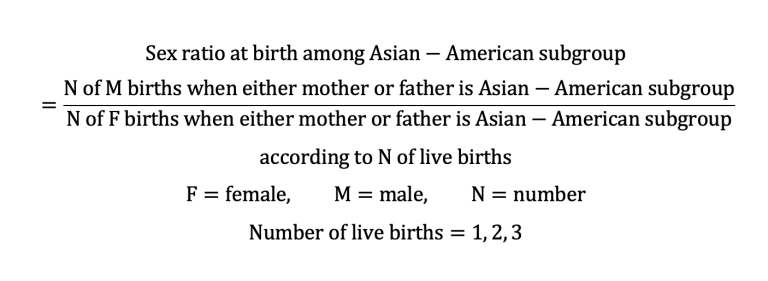
To explore the characteristics of associated factors of non-natural sex ratio at birth (SRB), we analyzed the National Vital Statistics System Natality Data from 2016 to 2021 (N=1,668,875). We defined Asian Americans as people with ancestors from Asia, including Asian Indian, Chinese, Filipino, Vietnamese, Korean, and Japanese. Additionally, we stratified data according to the Asian-American subgroup. Per each group, we estimated changes in the male-to-female SRB over time. We performed logistic regression for male birth, adjusting for birth order and sociodemographic factors.
Most Asian-American subgroups demonstrated SRBs within natural ranges for the first and second child, whereas, from the third child, SRBs skewed and differed by Asian-Americans. For respective Asian countries with skewed SRBs, Asian-American subgroups had lower SRBs than those. After adjustments, the third child had 8.0% greater odds (for male birth in the ratio scale) than the first in Asian Indians (95% CI 5.7, 10.4) and 6.9% greater odds in Chinese (95% CI 4.4, 9.5). Foreign-born mothers had 3.6% greater odds than U.S.-borns in Asian Indians (95% CI 2.0, 5.2) and 5.2% greater odds in Chinese (95% CI 3.5-6.9). Among the Filipinos, mothers with high school degrees had 2.2% lower odds than mothers with college degrees (95% CI 0.2, 4.1), while Japanese mothers with lower education categories had greater odds. Unmarried Asian Indians had 2.9% decreased odds than married (95% CI 0.0, 5.7), and unmarried Koreans showed 5.6% increased odds (95% CI 0.6, 10.9).
We found differential associations of SRB with sociodemographic factors and birth order by subgroup.
Future demographic analyses of SRBs must disaggregate Asian populations into subgroups. Policy actions need to consider the specific backgrounds of different Asian-American subgroups while empowering women in all Asian-American communities.
Asian American refers to race/ethnic groups with ancestors from China, Taiwan, Singapore, Japan, Korea, the Philippines, Vietnam, Thailand, Cambodia, Indonesia, Malaysia, India, Bangladesh, Pakistan, and Bhutan.1 Twenty-four million Asian Americans, which occupy 7% of the total U.S. population, are diverse in terms of race/ethnicity and sociodemographic factors.2 According to the U.S. Census, Indians have the highest median household income ($123,700) and proportions of college education (73%) among Asian Americans, whereas the Bhutanese had the lowest in both ($49,854 and 13%).2 Thus, grouping all these racial/ethnic subgroups may not be appropriate.
Sex ratio at birth (SRB, natural ratio, and range: 1.05 and 1.03-1.07) is a vital indicator for understanding demographic shifts.3,4 While the SRB can vary naturally, potentially due to biological processes that may be impacted by demographic characteristics, using an established range allows researchers to assess deviation from the natural SRB not accounted for by natural fluctuations. This includes both sex-selective in-vitro fertilization and abortion in the U.S.5 Thus, SRB can be used as an indirect marker of how distorted preferences for male children influence sex selection.
Historically, Asian countries have preferred the birth of boys over girls (referred to as “son preference”) as shown in the patrilineal societal structure in inheritance and marriage.6 Traditional son preference, combined with decreased fertility (“fertility squeeze”) and increased access to technology for abortion, is theorized to have led to skewed sex-selected abortion and prenatal sex determination.3,4,6 The United Nations Population Fund reported that 142 million females were missing in 2020 because of son preference and sex selection globally, an increase from 126 million missing females in 2010.4,7
Meanwhile, the trajectories of SRB among these countries have differed for the past decades (Figure 1). While South Korea’s SRB decreased to the natural ranges in the 2010s after peaking in the 1990s, Japan’s has been close to the natural ratio for decades.4,8 The estimates in China, Vietnam, the Philippines, India, and Taiwan showed recent decreasing trends but are still higher than the expected biological ratio.4
Figure 1. Sex ratio at birth from 1980 to 2021 among Asian countries
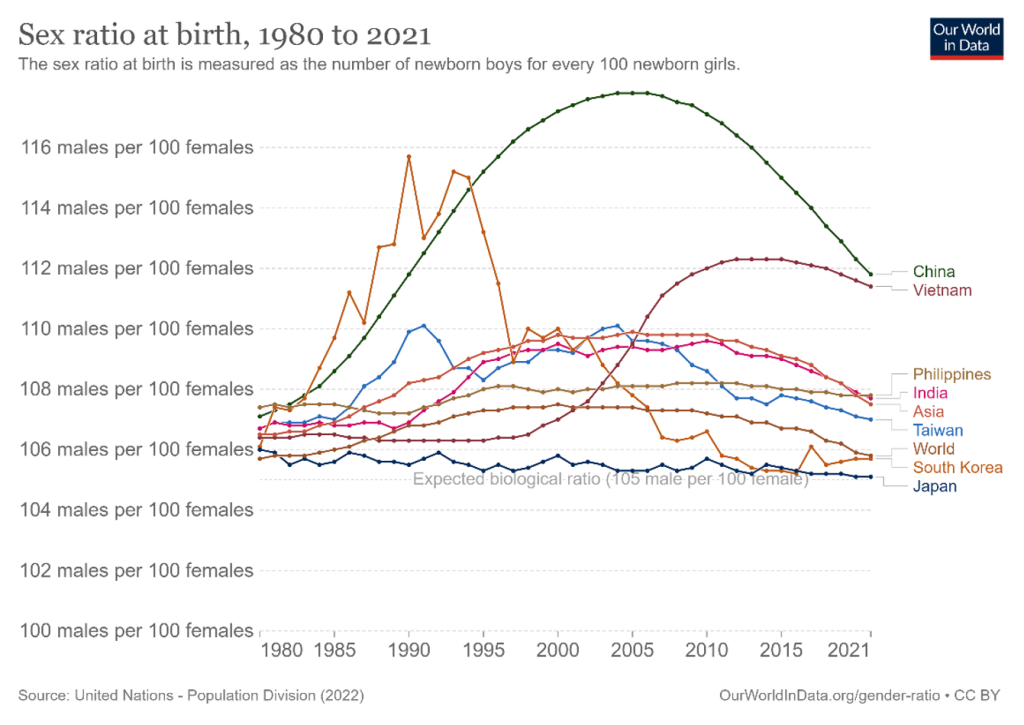
Note: ‘Our World in Data’ produced the original image based on the data from the United Nations-Population Division published in 2022.
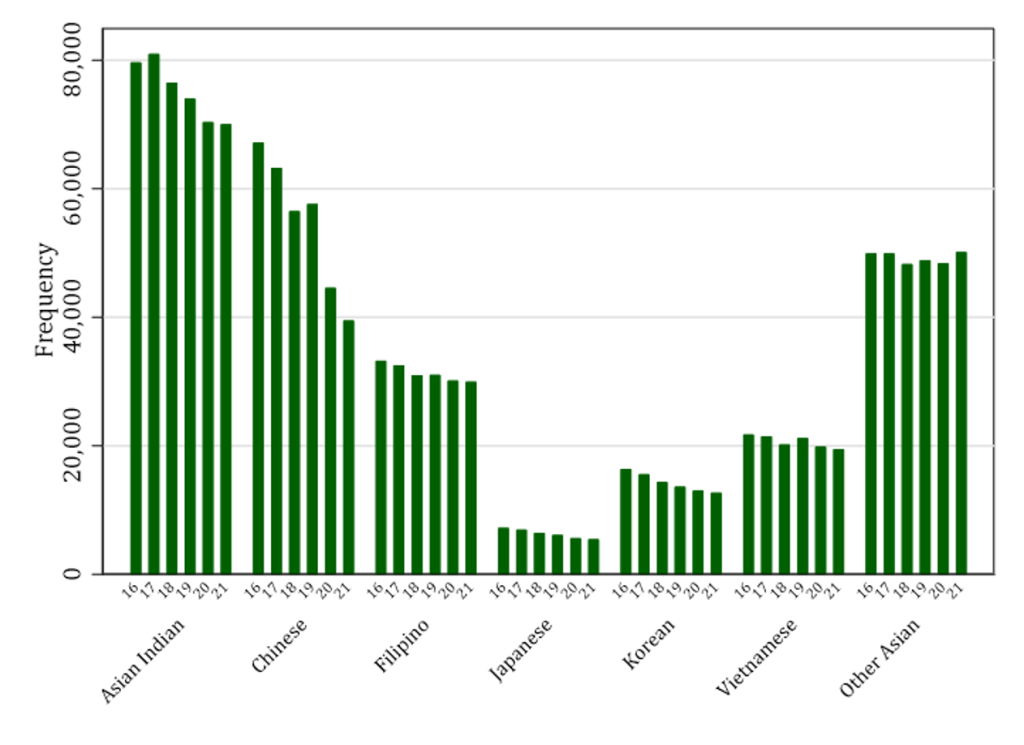
Figure 2. Number of births per year according to Asian American subgroups from 2016 to 2021
SRBs can also be examined among Asian-American groups within Western countries, and for multiparous families (those with more than one child), stratified by the biological sex of existing children. In a study using 2000 U.S. Census data, the SRB among families where both parents were either Chinese, Korean, or Indian was estimated to be 1.17 (for the second child if the first child was a girl) and 1.51 (for the third child if the two children were girls), while the SRB found to be within normal ranges in other cases of this aggregated Asian group.9 These tendencies were repeated in a follow-up study using the 2010 U.S. Census and 2011-2013 U.S. Natality Data, except among Korean Americans, who had natural SRB regardless of the sex of live births, in line with the changes in SRB in South Korea.10 In both, the White group showed the pattern within the natural ranges of SRB regardless of the sex of live births. Other studies in North America and Europe reported that the values from the original culture might have affected the sex ratio even after the migration.11–14
U.S. abortion policy changed from protective to restrictive in the mid-1990s in many states, particularly in the South and Midwest.15 The strong son preference in Asian countries and previous study findings of skewed SRB among the combined Asian-American populations, have led to the passage of sex-selective abortion ban policies in the U.S. targeting Asian-American communities.5,16,17 These bans have been placed or are thought to be placed within one year in 26 states, covering 1,309,200 reproductive-aged Asian women.18 Also, a greater proportion of minority ethnic Asian Americans were affected by the restrictive policy changes: 54% Burmese, 44% Bhutanese, and 42% Nepalese vs. 26% among all Asian American women.16 Moreover, the COVID-19 pandemic aggravated the diminished access to abortion care among Asian Americans.17
However, researchers pointed out that son preference is prevalent not only in Asian countries, but also in some African and European countries.4,5,19,20 Since previous studies also had not disaggregated Asian-American populations into specific ethnic groups, all Asian-American women were stigmatized without a deep understanding of the underlying context. As a result, abortion bans reduced access to abortion care for Asian women in the U.S. Additionally, recent policy changes have exacerbated public health concerns in the U.S. by increasing the number of preterm births and low birth weight newborns among Asian Americans.21 More broadly, women’s health suffers when access to reproductive healthcare is limited. Restrictions on access to reproductive care at a state level showed an association with a 5.81% increase in the suicide rate.22 Researchers suggested maternal mental health complications concerns, particularly in vulnerable populations with lower SES and racial minorities.23,24 Therefore, it is critical to the public health of Asian Americans that we interrogate whether SRBs truly fall outside of the natural range and are thus evidence of sex-selective abortion trends.
In previous studies, the SRB was measured among the combined Asian Americans rather than according to the specific Asian-American group.13,25 Additionally, it was suggested that SRB is associated with different sociodemographic and demographic factors.26 Therefore, to better understand the SRB trends among disaggregated Asian-American subgroups, we aimed to describe the recent changes in SRB among each Asian-American subgroup using nationally representative data and compare how this trend differs from the original Asian countries non-parametrically. Secondly, we aimed to explore which sociodemographic factors and birth order would be strongly associated with the SRB according to the disaggregated Asian-American subgroups.
We used the natality data from the National Vital Statistics System from 2016 to 2021. For the study period, Asian-American subgroups were defined as Asian Indian, Chinese, Filipino, Japanese, Korean, Vietnamese, and other Asians, the most specific categorization of the Asian-American population in the original data. All births (N=1,668,875) of children of parents, mothers, or fathers, whose race/ethnicity was Asian American were included in this analysis (Table 1). For missingness, we used the sex of the infant (0.00%) and the mother’s race (4.78%) as imputed from the original dataset.
Table 1. Proportions of parents’ race/ethnicity in the study population
Mother’s race (%) | Father’s race (%) | |
White | 129,174 (7.7) | 240,750 (14.4) |
Black | 7,741 (0.5) | 25,791 (1.6) |
American Indian and Alaska Native | 1,228 (0.1) | 1,474 (0.1) |
Asian Indian | 451,506 (27.1) | 434,932 (26.1) |
Chinese | 328,619 (19.7) | 267,697 (16.0) |
Filipino | 187,939 (11.3) | 122,855 (7.4) |
Japanese | 37,871 (2.3) | 22,715 (1.4) |
Korean | 85,681 (5.1) | 65,034 (3.9) |
Vietnamese | 124,055 (7.4) | 93,631 (5.6) |
Other Asians | 295,578 (17.7) | 237,324 (14.2) |
Hawaiian | 178 (0.0) | 289 (0.0) |
Guamanian | 323 (0.0) | 569 (0.0) |
Samoan | 182 (0.0) | 469 (0.0) |
Other Pacific Islander | 604 (0.0) | 829 (0.1) |
More than one race | 18,196 (1.1) | 30,950 (1.9) |
Unknown | 123,566 (7.4) | |
Total | 1,668,875 (100.0) | 1,668,875 (100.0) |
During the study period, we reported the changes in SRB according to mother-reported Asian-American subgroups and the number of live births up to the third child.
As a sensitivity analysis, we also limited the subgroup when both parents’ Asian-American subgroups were the same, excluding the other Asian strata whose Asian-American race/ethnicity was not specified: 78.9% of Asian Indian, 62.0% of Chinese, 32.1% of Filipino, 23.9% of Japanese, 40.0% of Korean, and 50.4% of Vietnamese. Additionally, we limited the subgroup when the mother’s race/ethnicity was the same as the subgroup: 91.1% of Asian Indian, 89.3% of Chinese, 79.9% of Filipino, 77.5% of Japanese, 79.6% of Korean, and 85.7% of Vietnamese.
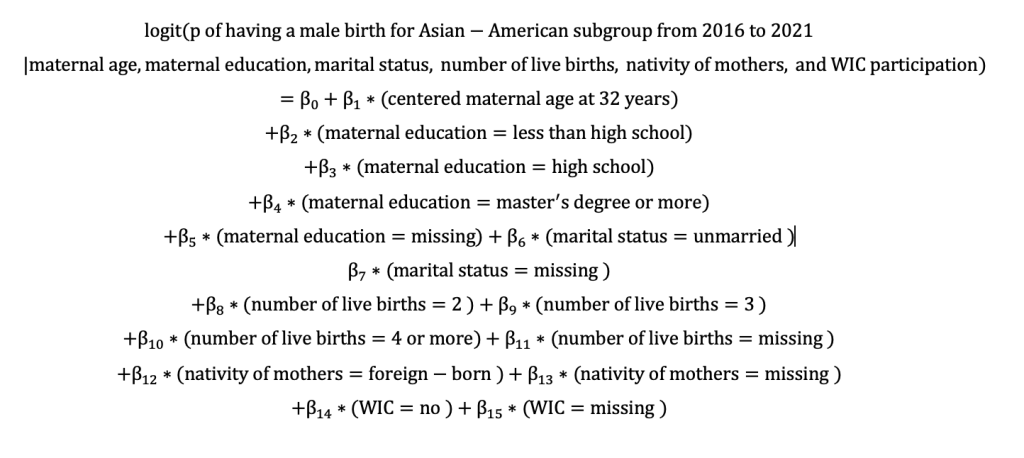
Within each Asian-American subgroup, we performed multivariable logistic regression, with the outcome set to having a male birth (biological sex: male=1, female=0) and adjusting for maternal age, maternal education, marital status, birth order (number of live births), nativity of mothers (U.S.-born vs. foreign-born), and Special Supplemental Nutrition Program for Women, Infants, and Children (WIC) participation (a surrogate measure of socioeconomic status). As described above, each Asian-American subgroup was defined as having a mother or father of the specific Asian-American race/ethnicity. The obtained adjusted odds ratio could be interpreted as a ratio between the odds of having a male birth compared to the odds of having a female birth with the specific predictor value, while the other predictors were fixed within the strata of the Asian-American subgroup. We used the imputed variables from the original dataset for missingness: mother’s age (0.03%) and marital status (0.03%). For categorical variables, we treated missingness as one of the categories: number of live births (0.24%), mother’s nativity (0.34%), mother’s education (3.06%), marital status (22.9%), and WIC participation (20.5%).
We repeated the model below for Asian-American subgroups.
All statistical analyses were done using STATA/IC 16.1, and a two-sided p-value of 0.05 was used for the significance level.
Description of the study population
During the study period, the total number of births decreased from 301,370 in 2016 to 255,064 in 2021. The sex ratio ranged from 1.06 in 2020 and 2021 to 1.07 in 2019 (“A year of Golden Pig,” a promising year according to the Chinese Zodiac that a child born in this year is believed to live a prosperous life) (Table 2). In Table 3, the proportion of foreign-born mothers ranged from 58.1% among the Filipino subgroup to 83.2% among the Asian Indian subgroup. The proportion of mothers with less than high school education ranged from 1.6% among the Korean subgroup to 14.1% among other Asians. WIC participation was the lowest among the Japanese subgroup (9.7%) and the highest among other Asians (35.4%).
Table 2. Number of male and female births per each study year in the study population
Year | Sex of Infant | Total | Sex ratio at birth | |
Female | Male | |||
2016 | 145,805 | 155,565 | 301,370 | 1.067 |
2017 | 143,621 | 152,778 | 296,399 | 1.064 |
2018 | 135,634 | 143,998 | 279,632 | 1.062 |
2019 | 134,449 | 144,235 | 278,684 | 1.073 |
2020 | 125,094 | 132,632 | 257,726 | 1.060 |
2021 | 123,813 | 131,251 | 255,064 | 1.060 |
Total | 808,416 | 860,459 | 1,668,875 | 1.064 |
Table 3. Characteristics of the study population according to Asian American subgroupsa
Asian Indian (n=495,533) | Chinese (n=368,071) | Filipino (n=235,269) | Japanese (n=48,890) | Korean (n=107,641) | Vietnamese (n=144,774) | Other Asians (n=345,085) | |
Age of mothers* (median, IQR) | 32 (29-34) | 33 (29-36) | 32 (28-36) | 34 (31-37) | 34 (31-36) | 32 (29-35) | 31 (27-34) |
Number of live births | |||||||
Number of live births b (median, IQR) | 2 (1-2) | 2 (1-2) | 2 (1-2) | 2 (1-2) | 2 (1-2) | 2 (1-2) | 2 (1-3) |
Number of live births=1 (%) | 233,401 (47.1) | 180,263 (49.0) | 98,854 (42.0) | 22,627 (46.3) | 52,448 (48.7) | 64,118 (44.3) | 133,418 (38.7) |
Number of live births=2 (%) | 200,358 (40.4) | 139,254 (38.0) | 80,784 (34.3) | 17,943 (36.7) | 36,457 (35.7) | 51,870 (35.8) | 112,032 (32.5) |
Number of live births=3 (%) | 43,582 (8.8) | 36,351 (9.9) | 36,833 (15.7) | 5,887 (12.2) | 12,125 (11.3) | 20,371 (14.1) | 56,480 (16.4) |
Number of foreign-born mothers* (%) | 412,382 (83.2) | 287,502 (78.1) | 136,725 (58.1) | 29,125 (59.6) | 66,721 (62.0) | 99,702 (68.9) | 221,805 (64.3) |
Mother’s education level (%) | |||||||
Less than high school | 21,584 (4.3) | 18,832 (5.12) | 8,011 (3.4) | 1,197 (2.4) | 1,767 (1.6) | 11,309 (7.8) | 46,799 (14.1) |
High school | 65,415 (13.2) | 61,454 (16.70) | 75,099 (31.9) | 9,240 (18.9) | 16,934 (15.2) | 51,855 (35.8) | 120,075 (34.8) |
College graduate | 188.187 (38.0) | 139,726 (38.0) | 116,920 (49.7) | 26,003 (53.2) | 51,838 (48.1) | 53,012 (36.6) | 111,300 (32.3) |
Master’s degree or more | 208,230 (42.0) | 133,727 (36.3) | 28,110 (12.0) | 11,194 (22.9) | 35,269 (32.8) | 23,366 (16.1) | 55,440 (16.1) |
Marriage status: number of married (%) | 399,799 (95.0) | 217,902 (87.9) | 124,385 (77.1) | 32,600 (88.4) | 74,999 (89.8) | 84,127 (78.9) | 213,621 (76.6) |
WIC participant: number of yes (%) | 67,360 (13.6) | 60,044 (16.3) | 46,541 (19.8) | 4,726 (9.7) | 10,763 (10.0) | 31,684 (21.9) | 122,083 (35.4) |
The overall SRB per Asian-American subgroup
The overall SRB per each Asian-American subgroup was generally within the range of natural SRB (the overall 1.06): Asian Indian 1.06, Chinese 1.09, Filipino 1.07, Japanese 1.04, Korean 1.05, Vietnamese 1.06, and other Asians 1.05. In the sensitivity analyses, both estimates were similar to the original analysis.
SRB according to the birth order
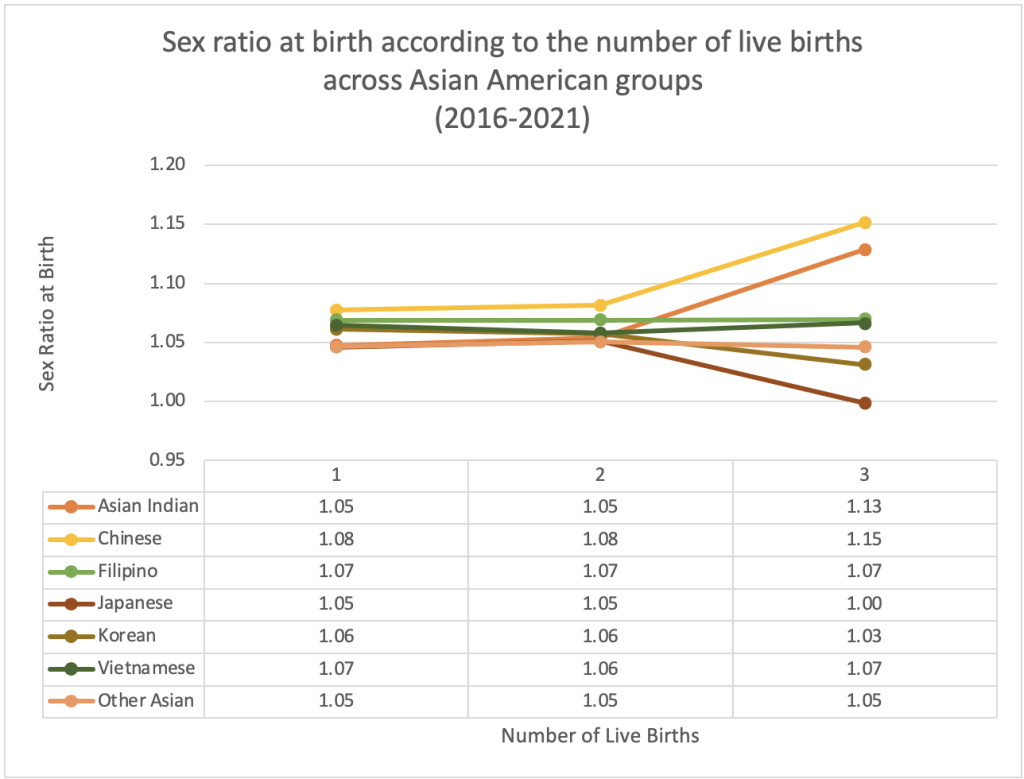
The SRB, according to the number of live births, showed divergence in both directions from the third child across Asian-American groups (Chinese 1.15, Asian Indian 1.13, Vietnamese 1.07, Filipino 1.05, Korean 1.03, 1.00 in Japanese, 1.08 in the total sample) (Figure 3). In the sensitivity analysis, we obtained similar estimates.
Figure 3. Sex ratio at birth according to the number of live births across Asian American subgroups
The comparison of SRB between Asian-American subgroups and their respective Asian countries
Compared to the SRB in India, SRB estimates among the Asian Indian subgroup were lower and within the natural ranges (Figure 4A). In Figure 4B, the SRB in the Chinese subgroup was lower than the estimate in China but greater than that in two other Asian countries with Chinese ethnic backgrounds: Taiwan and Singapore. Among the Filipino subgroup, the estimate was the same in the Philippines in 2016 but fluctuated while showing a trend of decreasing within natural SRB (Figure 4C). While the estimates among the Japanese and Korean subgroups were consistently around 1.05 during the study period, SRBs of Japanese and Koreans showed fluctuations resulting from their relatively small population compared to the other subgroups (Figure 4D and 4E). The Vietnamese subgroup’s SRB was generally within the natural range and lower than in Vietnam. Other Asian Americans showed a fluctuating trend within the natural SRB range (Figure 4F).
Figure 4. Changes in sex ratio at birth the Asian countries and Asian American subgroup populations
Figure 4A.
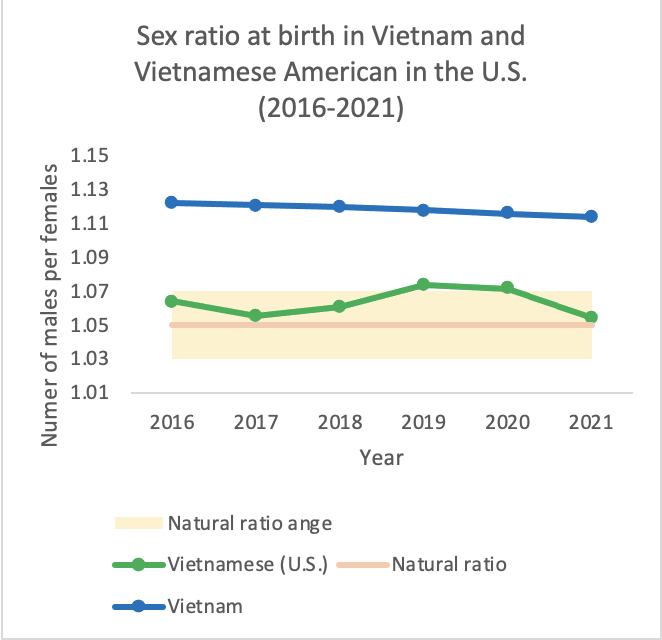
Figure 4C.
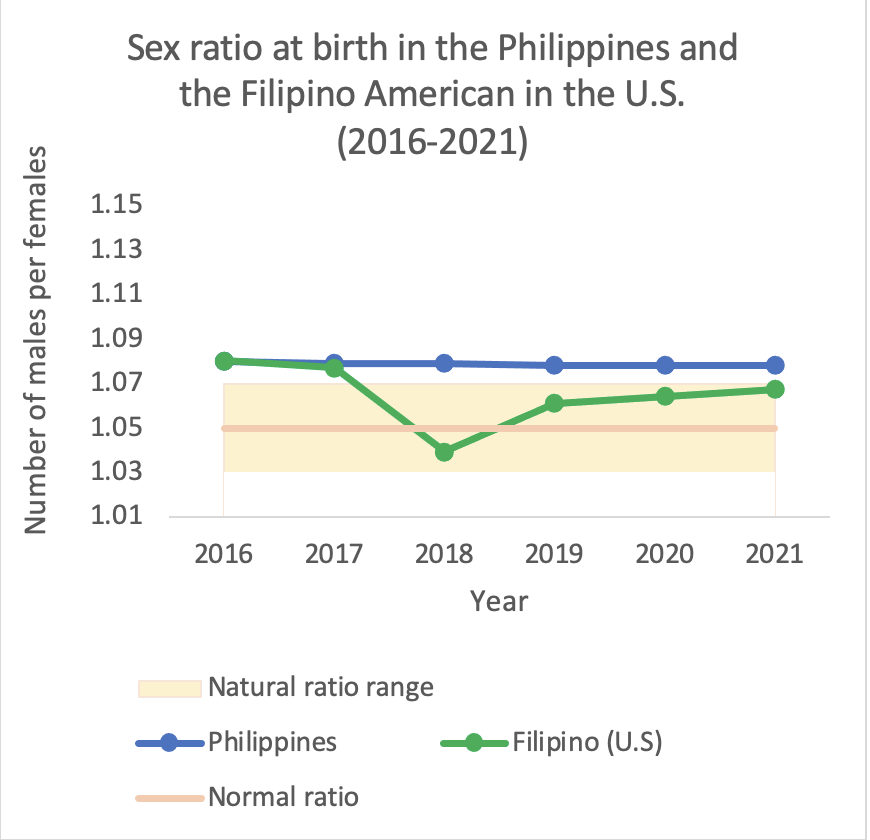
Figure 4E.
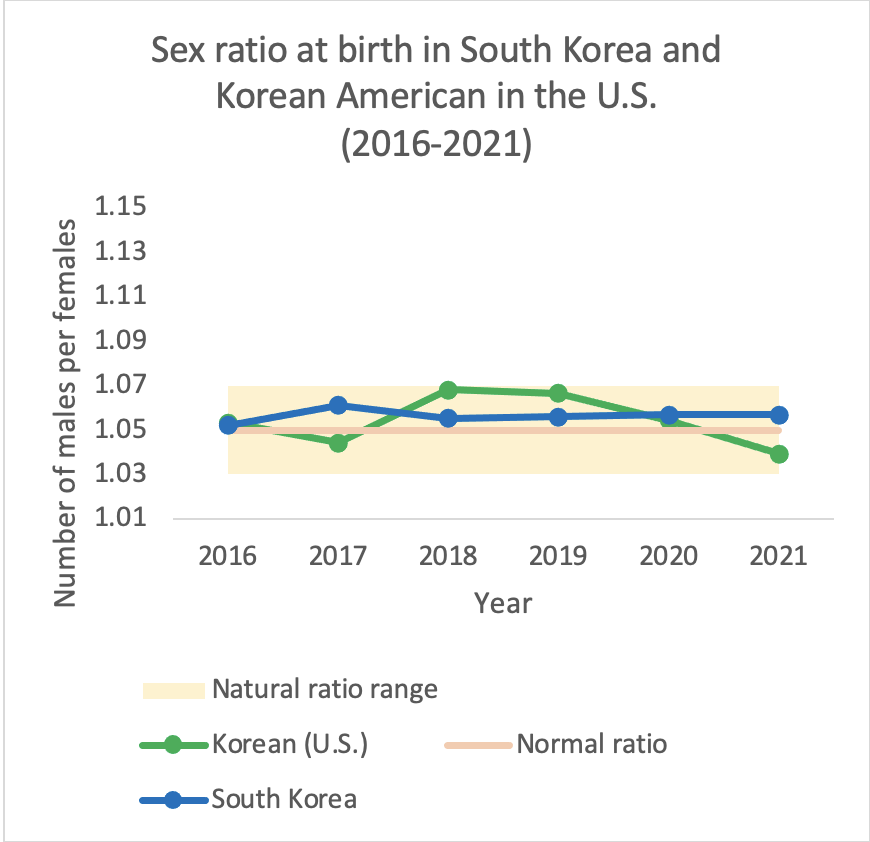
Figure 4G.
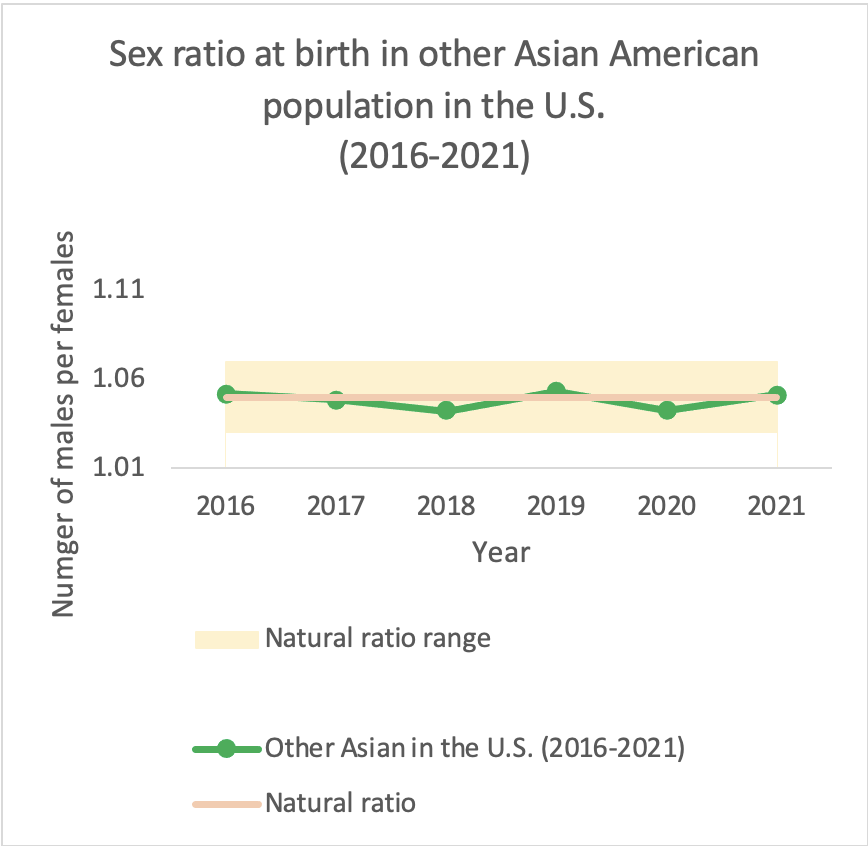
Figure 4B.
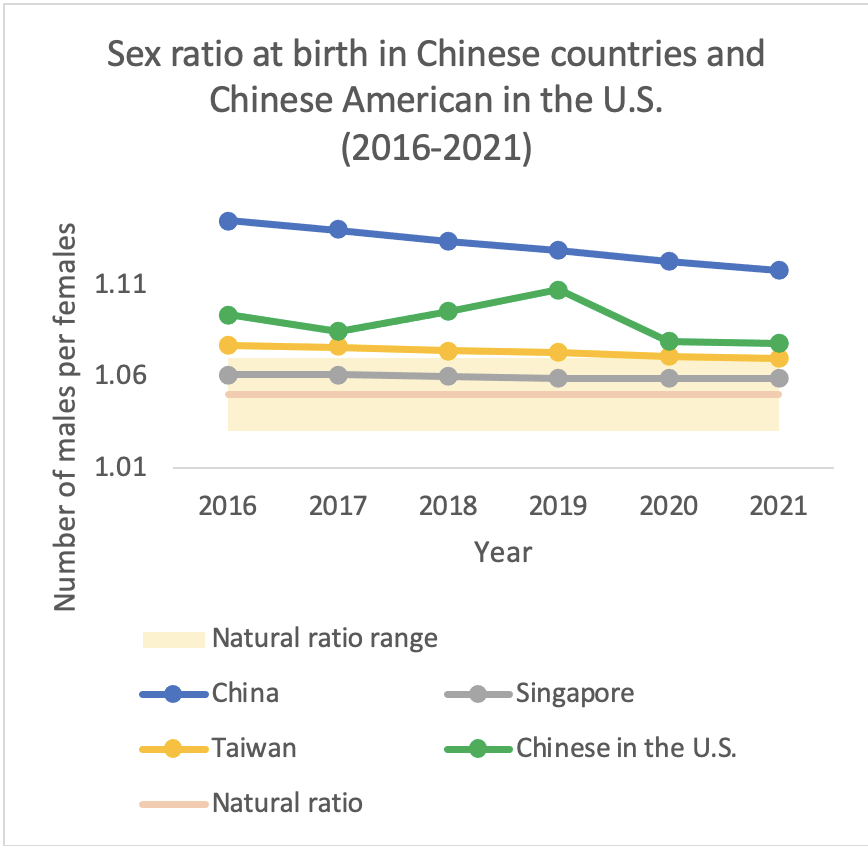
Figure 4D.
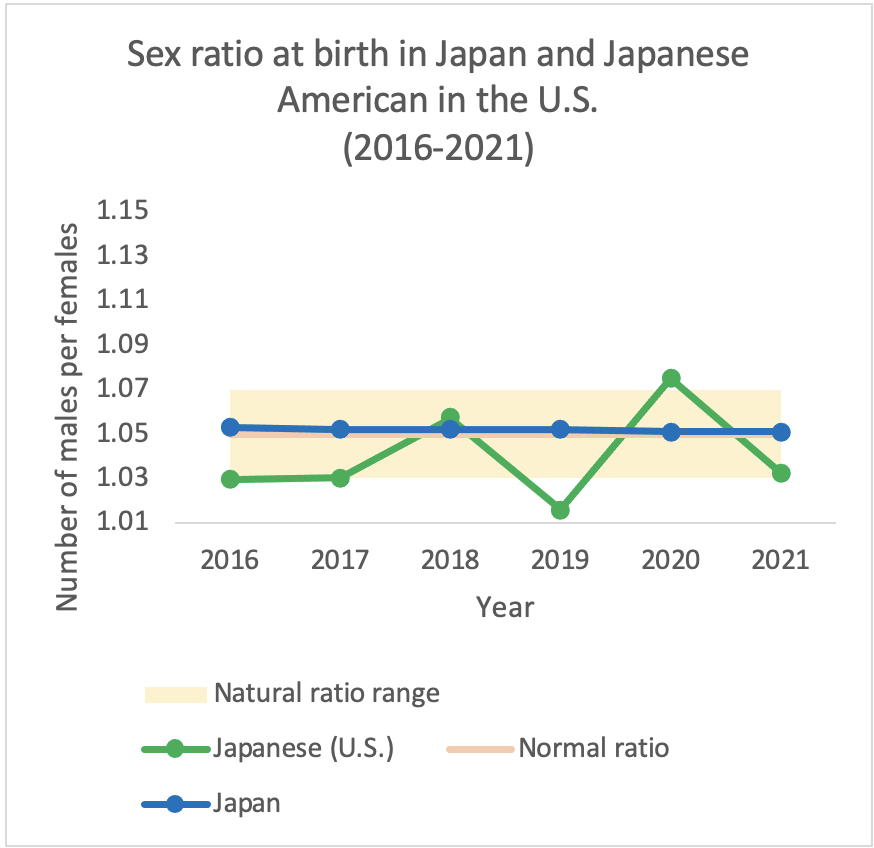
Figure 4F.
Note. The sex ratio at birth in Asian countries was obtained from the United Nations data.
In our multivariable logistic regression analysis, we could see the different associations between various sociodemographic factors and having a male birth within each Asian-American subgroup (Table 4).
Table 4. The association (odds ratio) between having a male live birth and sociodemographic factors among the Asian American subgroups (2016-2021)
| Asian Indian | Chinese | Filipino | Japanese | Korean | Vietnamese | Other Asians |
Number of populations | 495,533 | 368,071 | 235,269 | 48,890 | 107,641 | 144,774 | 345,085 |
Odds ratio (SE) | |||||||
Intercept | 1.021* (0.009) | 1.035** (0.000) | 1.068** (0.011) | 1.071** (0.023) | 1.054** (0.015) | 1.064** (0.015) | 1.040** (0.010) |
| |||||||
Maternal age (centered at 32-year-old) | 1.000 (0.007) | 1.000 (0.001) | 0.998** (0.010) | 0.999 (0.002) | 0.998 (0.001) | 0.999 (0.001) | 0.999 (0.010) |
Marital status (reference: married) | |||||||
Unmarried | 0.971* | 0.999 | 1.002 | 0.987 | 1.056* | 0.970 | 0.997 |
| (0.015) | (0.013) | (0.013) | (0.035) | (0.026) | (0.015) | (0.010) |
Unknown | 1.010 | 1.016* | 0.995 | 1.014 | 1.018 | 0.990 | 0.997 |
| (0.008) | (0.007) | (0.010) | (0.022) | (0.015) | (0.013) | (0.009) |
Number of live births (reference: 1st child) | |||||||
2nd child | 1.006 | 1.004 | 1.005 | 1.010 | 1.001 | 0.993 | 1.005 |
| (0.006) | (0.007) | (0.010) | (0.020) | (0.014) | (0.012) | (0.008) |
3rd child | 1.080** | 1.069** | 0.993 | 0.949 | 0.980 | 1.001 | 1.003 |
| (0.012) | (0.013) | (0.013) | (0.028) | (0.020) | (0.017) | (0.011) |
4th or more | 1.066** | 1.134** | 1.007 | 0.920 | 0.962 | 1.007 | 1.009 |
| (0.018) | (0.023) | (0.017) | (0.041) | (0.031) | (0.025) | (0.012) |
Unknown | 1.038 | 1.206* | 0.805* | 1.172 | 1.054 | 1.008 | 1.096 |
| (0.061) | (0.088) | (0.073) | (0.236) | (0.131) | (0.107) | (0.074) |
Nativity of mothers (reference: U.S.-born) | |||||||
Foreign-born | 1.036** | 1.052** | 1.014 | 0.969 | 1.019 | 0.999 | 1.008 |
| (0.008) | (0.009) | (0.009) | (0.019) | (0.013) | (0.012) | (0.008) |
Unknown | 0.980 | 1.092 | 1.059 | 0.829 | 1.026 | 1.120 | 0.983 |
| (0.063) | (0.091) | (0.075) | (0.181) | (0.048) | (0.158) | (0.055) |
Maternal education (reference: college graduate) | |||||||
Less than high | 0.984 | 1.012 | 0.984 | 1.089 | 0.929 | 1.018 | 1.001 |
| (0.015) | (0.017) | (0.024) | (0.067) | (0.048) | (0.022) | (0.012) |
High school | 1.005 | 1.003 | 0.978* | 1.054* | 0.981 | 1.007 | 0.995 |
| (0.010) | (0.010) | (0.010) | (0.027) | (0.019) | (0.013) | (0.009) |
Master’s or higher | 0.988 | 0.988 | 1.000 | 0.942** | 0.981 | 1.004 | 1.012 |
| (0.006) | (0.008) | (0.014) | (0.022) | (0.014) | (0.016) | (0.022) |
Unknown | 1.035 | 1.071** | 0.979 | 1.028 | 0.951 | 1.010 | 1.010 |
| (0.020) | (0.019) | (0.024) | (0.061) | (0.041) | (0.030) | (0.022) |
Food supplement membership (reference: no) | |||||||
Unknown | 1.015 | 0.967 | 1.040 | 1.004 | 0.897* | 1.006 | 0.987 |
| (0.021) | (0.029) | (0.036) | (0.064) | (0.049) | (0.045) | (0.028) |
Yes | 1.000 | 0.983 | 0.984 | 0.970 | 0.983 | 1.018 | 0.998 |
| (0.009) | (0.010) | (0.011) | (0.032) | (0.021) | (0.014) | (0.008) |
The association between male birth and birth order
After adjusting for other sociodemographic factors, birth order was associated with male birth. The third child had greater odds of being male than the first in both the Asian Indian (adjusted odds ratio [aOR] 1.080; 95% CI 1.057, 1.104) and Chinese (aOR 1.069; 95% CI 1.044, 1.095) subgroups. In the Filipino subgroup, a child with an unknown birth order had lower odds of being male (aOR 0.804; 95% CI 0.674, 0.961).
The association between male birth and demographic factors
Maternal age was slightly negatively associated with male birth, with a statistical significance only in the Filipino (aOR 0.998; 95% CI 0.996, 1.000). While unmarried Asian Indian mothers had decreased odds of male birth compared to married Asian Indian mothers (aOR 1.030; 95% CI 1.000, 1.061), unmarried Korean mothers had increased odds compared to their married Korean counterparts (aOR 1.056; 95% CI 1.006, 1.109). Within the Chinese subgroup, unknown marital status was associated with greater male birth odds than married couples (aOR 1.016; 95% CI 1.002, 1.031).
The association between male birth and social determinants
Among Asian Indian and Chinese subgroups, foreign-born mothers had greater odds of male birth than U.S.-born mothers after adjusting for other factors (Asian Indian 1.036; 95% CI 1.020, 1.052, Chinese 1.052; 95% CI 1.035, 1.069). Chinese mothers with unknown education levels had greater odds than mothers with a college degree of having a male birth (aOR 1.071; 95% CI 1.034, 1.110). Filipino mothers with high school degrees had slightly lower odds than mothers with a college degree (aOR 0.978; 95% CI 0.959, 0.998) of having a male birth. Among the Japanese, mothers with high school degrees had slightly greater odds than mothers with a college degree (aOR 1.053; 95% CI 1.002, 1.108) of male birth, whereas mothers with master’s degree or higher had lower odds than mothers with a college degree (aOR 0.942; 95% CI 0.900, 0.985). Korean mothers with unknown WIC participation (1.29% of the Korean subgroup) had lower odds of male birth than those without participation (aOR 0.983; 95% CI 0.942, 0.998).
In this study, we found that Asian-American subgroups have heterogeneous SRB estimates, ranging from 1.04 among Japanese Americans to 1.09 among Chinese Americans. When we compared the SRB among each Asian subgroup with the SRB of their respective Asian countries, the SRB in Asian-American subgroups was lower than in the Asian countries, where the respective Asian countries had SRB greater than the natural ranges (notably in China, the Philippines, India, and Vietnam). The respective Asian-American subgroups also showed corresponding patterns for Korea and Japan, where the recent SRBs were within natural ranges. This study’s finding on heterogeneity between Asian-American subgroups is aligned with previous studies that reported these estimates up to the early 2010s.10,27
Differences in patterns across subgroups were further observed when looking at parity-specific SRBs. The SRB for the third child in the Chinese and Indian subgroups increased, and decreased in the Japanese subgroup. In addition, in this study, the estimates of Vietnamese, Filipino, and other Asians did not show changes according to the birth order. This finding differs from a study leveraging U.S. 2010 Census data assessing SRBs according to the sex of the existing children, which found that if two children were daughters, SRBs were 1.43 in Chinese and 1.30 in Asian Indian subgroups.10
In the adjusted analysis, we found that the association between male birth and sociodemographic factors and birth order differed across Asian-American subgroups. Higher education attainment showed contradicting effects on SRBs.4 Among Filipinos, mothers with high school degrees had 2.2% lower odds than mothers with college degrees of male birth, whereas, among the Japanese, mothers with lower education had greater odds of male birth. In a previous study in Inda, education measured by literacy had an inverted U-shaped relationship with SRB, suggesting a non-linear link between SRBs and education.28 In the U.S., Filipino and Japanese mothers with less than a high school education had higher SRBs.27
Mothers’ birth order and nativity were important factors for SRB, particularly among Chinese and Asian Indian subgroups. The 3rd child had 8.0% greater odds than the first in Asian Indians and 6.9% greater odds in Chinese. Foreign-born mothers had 3.6% greater odds for male birth than U.S.-borns in Asian Indians and 5.2% greater odds in Chinese. A 1-year increase in maternal age was associated with a 0.2% decrease in odds in the Filipinos. Another study also reported that younger mothers had higher SRBs when both parents were of the same race/ethnicity.29
In addition, the directions of association between male birth and marital status differed among subgroups. Unmarried Asian Indians were associated with 2.9% decreased odds for male birth than married, whereas unmarried Koreans showed 5.6% increased odds. A recent study reported that compared to unmarried parents with the same race/ethnicity, married counterparts had lower SRBs regardless of race/ethnic groups in the U.S.29 The opposite directions of associations might suggest that the degree of access to reproductive health care services might have differed according to sociodemographic factors and live births within each subgroup, contributing to skewed SRBs. Moreover, given that pre-implantation sex selection is legal and widely available in the U.S., we should not interpret these findings as a direct result of sex-selective abortion.5
Instead, the heterogeneity would suggest the diversities in demographic transition and economic growth stages in the original Asian countries and the preserved cultural values among the subgroups, suggesting the need to incorporate the subcultural values in future studies and policy implications.30–32 Particularly, previous studies also stressed the importance of improving economic opportunities for women to weaken the son preference rather than regulating sex-selective abortions.32,33 Therefore, challenging inequitable gender norms more broadly would be essential to address the underlying root causes of preference for sons in Asian-American communities. Also, it would be vital to take into account that abortions among mothers in the U.S. are decided by financial status or absence of a committed partner rather than the sex of a baby.34,35 Lastly, while the values and identity of Asian Americans might be influenced by traditional Asian culture, they will also reflect the culture of American society and Asian-American communities (Figure 5).31
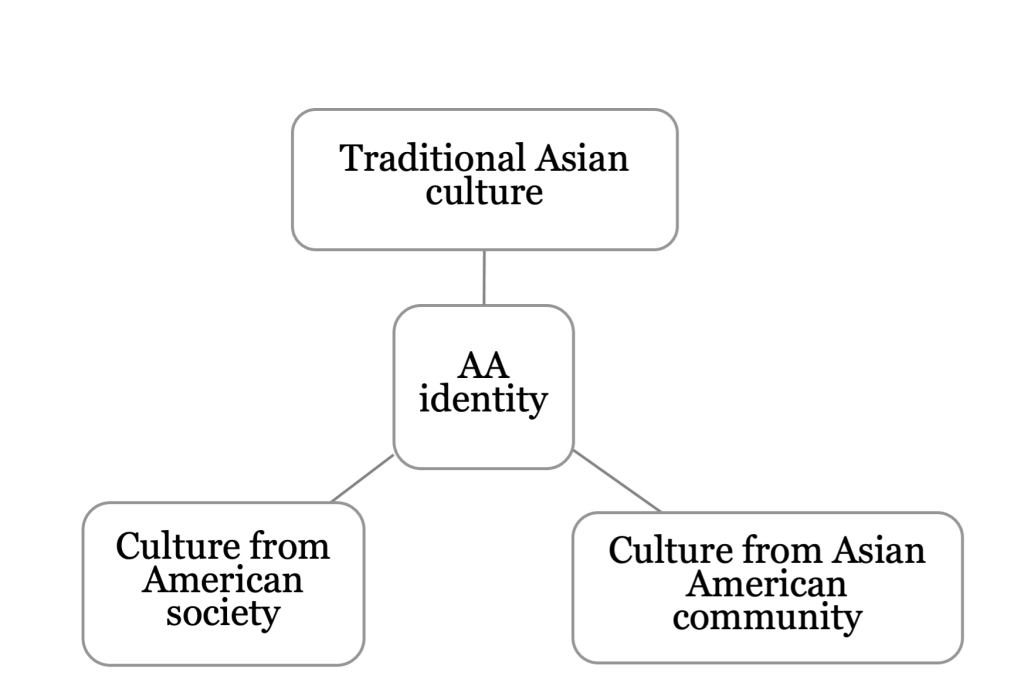
Figure 5. Triangular relationship of Asian American (AA) identitity suggested by Dr. Hesung Chun Koh
This study has limitations. While we intend to understand the diverse characteristics of Asian-American subgroups, several Asian-American subgroups were not specifically defined in the original dataset and aggregated as other Asians. Lower-income Asian Americans who were found to be directly affected by abortion policies are also included in the other Asian-Americans subgroup.17 Furthermore, regarding economic status, only participation in the supplemental food program was available in the original dataset, which might leave a residual confounding.
From recent nationwide population data, we could see that SRBs are higher than natural among certain Asian-American subgroups, and that patterns in SRB vary widely among race/ethnicity Asian-American subgroups. Though the magnitude was small, we could find that according to Asian-American subgroups, different factors were associated with SRB. The heterogeneity of SRBs would suggest the diversities and complexities that influence SRBs among Asian Americans.
This study underscores the importance of disaggregating the Asian Americans when exploring demographic patterns rather than utilizing monolithic “Asian.” Future research directions should encourage community-informed research that could reflect the needs of the diverse Asian Americans.17 Additionally, our findings highlight that outreach must target ethnic groups’ specific needs through partnerships with community organizations. While guaranteeing full access to reproductive health care services, we need long-term policy changes that empower women in Asian-American communities.36
Dr. Hyelee Kim is a PhD student in the Department of Epidemiology and Biostatistics at the University of California, San Francisco. Her research areas include psychiatric epidemiology, particularly causal inference, and machine learning for identifying mental health disparity.
Rachel Murro is a PhD student in the Department of Epidemiology and Biostatistics at the University of California, San Francisco. Her research focuses on sexual and reproductive health.
Dr. Jee Eun Park is an Associate Professor in the Department of Psychiatry and Behavioral Sciences at the Seoul National University Hospital in South Korea. Her research interest includes psychiatric epidemiology, dementia prevention, and digital therapeutics for mental health.
Dr. Yeojin (Julie) Kim is an Associate Professor in the Department of Communication at Central Connecticut State University. Her research areas include new media and strategic communication in the socio-political and intercultural contexts.
Dr. Youngseon Kim is an associate professor in the Department of Marketing, School of Business at Central Connecticut State University. Her research interest includes luxury brand consumption and marketing in nonprofit arts and cultural organizations.
Dr. Patty Lee, a Professor of Medicine at the Icahn School of Medicine at Mount Sinai, is a physician-scientist who leads inter-disciplinary research programs in lung-vascular aging and has been involved in East Rock Institute during the 21 years she was faculty in the Yale School of Medicine.
Dr. Hesung Chun Koh, Co-Founder and Chair Emerita, East Rock Institute. She is also a Director Emeria, East Asian Research, HRAF, Yale University. Her research areas are the interdisciplinary comparative culture research and teaching, East Asian law and Culture (Yale Law School), Gender Roles: comparative view, and Korean Society and Culture (Yale University) HRAF, Yale University, 1961-1988.
Dr. Nadia Diamond-Smith is an associate professor at the University of California San Francisco. Her research interests are in reproductive and maternal health, mostly in South Asia. She received her training from the Johns Hopkins Bloomberg School of Public Health.
HPHR.org was designed by ComputerAlly.com.
Visit HPHR’s publisher, the Boston Congress of Public Health (BCPH).
Email communications@bcph.org for more information.
Click below to make a tax-deductible donation supporting the educational initiatives of the Boston Congress of Public Health, publisher of HPHR Journal.![]()