
Prasad S, Hswen Y. Political affiliation and human mobility under stay-at-home orders: a difference-in-difference analysis with county and time fixed effects. Harvard Public Health Review. 2021; 26.
DOI:10.54111/0001/Z8
In late March 2020, state and local governments across the country issued stay-at-home directives to slow the spread of COVID-19. However, divergent messages from political parties on the severity of COVID-19 and differing levels of support of these social distancing measures have potentially prompted differential behaviors across political groups. This study examines state-level partisan differences in changes in human mobility during stay-at-home orders.
Aggregated and de-identified large-scale human mobility data was collected from Cuebiq, a mobility insights platform, to measure the fraction of users that staying at home. A difference-in-difference analysis was performed to evaluate the changes in human mobility before and after stay-at-home orders were implemented by state political afflictions.
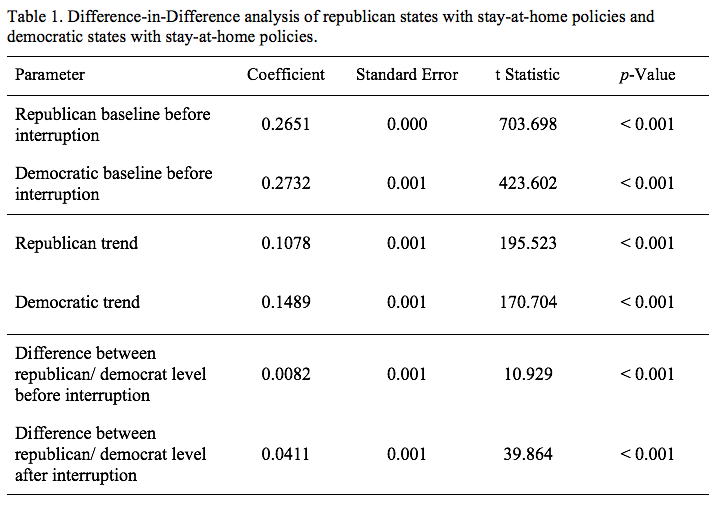
Before March 19th, 2020, there was a 0.82% difference (SE=0.003, p<0.001) between the percent of users staying at home in republican states versus democratic states. Difference-in-difference analysis revealed that on average, democratic states experienced a 4.11% (SE = 0.006, p<0.001) greater increase in the percent of users that stayed at home compared to republican states pre-post the implementation of stay-at-home orders. States that were not issued state-wide stay-at-home orders were excluded from the study.
Evidence supports the differential changes in adherence to stay-at-home orders by state political affiliation. These results suggest that political messaging may be a strong factor in influencing social distancing behaviors.
In the United States alone, there have been over 5 million confirmed cases of the Coronavirus disease, and over 167 thousand deaths as of August 14th, 2020 (“WHO Coronavirus Disease (COVID-19) Dashboard,” 2020). In response to the pandemic, and in the absence of pharmaceutical measures, state and local governments have turned to social distancing measures as the primary mitigation strategy to curb transmission of the virus. Social distancing measures primarily took the form of stay-at-home orders where individuals were urged not to leave the house for anything other than essential purposes (The New York Times, 2020). However, government-enforced social distancing policy is only as effective as the extent to which people adhere to it. As governments across the country continue to look towards directives to reduce the spread of the virus, understanding the factors that influence people’s compliance is crucial to ensuring that these policy measures remain as effective as possible.
In the early stages of the COVID-19 pandemic, President Trump suggested that the coronavirus was no worse than the flu, advocated for an earlier end to the lockdown and was against the national mandate on mask wearing. (Liptak, 2020) A preliminary survey conducted by the Pew Research Center (Green, 2020) found that public opinion on the coronavirus outbreak is divided along party lines, suggesting that political beliefs are a potential factor in influencing an individual’s social distancing behavior. This Pew Research study found that . Survey results have shown significant gaps between republican and democratic individuals in beliefs about need to socially distance, disease risk and pandemic severity Studies have also found significant associations between belief in science and party alignment with level of physical distancing (Brzezinski, Kecht, Van Dijcke, & Wright, 2020). Democrats report more concerns about COVID-19 and higher levels of social distancing compared to Republicans. However, it is unclear whether these differences in political affiliation translate into actual differences in behaviors around human mobility.
Human mobility data was obtained from Cuebiq’s mobility insights platform. (Cuebiq, 2020) Cuebiq is a location intelligence and measurement platform and provides access to de-identified, large-scale human mobility data that is collected from over 15 million mobile devices. through a General Data Protection Regulation compliant framework. Previous studies have validated the use of this dataset to assess mobility changes in response to the COVID-19 pandemic in the United States and across the world (Grantz et al., 2020) First-party data is collected through smartphone applications that are able to provide geographical coordinates using various location data sources such as GPS, Wifi, beacons or networks. Human mobility was quantified using the aggregated movements of all the users in the county by taking the largest diagonal observed through all the user’s locations on each day. Users that are moving less than 330 feet (~ 100 m) from their home are considered to be staying at home, and the total fraction of users staying at home in any given county comprises this index. Data was collected from January 1st, 2019 to May 9th, 2020.
A Difference-in-difference model (DiD) was used to study the relationship of state political affiliation and adherence to state-level stay-at-home orders. In this design we used DiD to estimate the differences between republican and democratic state affiliations by comparing the changes in the percent of the population staying at home over the time period surrounding the enactment of stay-at-home orders in the United States (“Difference-in-Difference Estimation,” 2020).
Our study aimed to isolate the differential impact of stay-at-home orders on human mobility based on state political affiliation. Our approach follows the difference-in-difference model with varying treatment times proposed in Goodman-Bacon (2018) and applied in many similar studies related to social distancing behavior in response to Covid-19 (Brzezinski et al., 2020; Painter & Qiu, 2020; Wright, Sonin, Driscoll, & Wilson, 2020). We obtain our main results by estimating the following equation:
whereas the fraction of users staying at home in county c at time t, is the state policy, where = 1 if at time t, a stay-at-home order has gone into effect in state s. represents the political affiliation of the state, wherein republican states and in Democratic states. To account for the staggered stay-at-home order time points for each state, we included county and time fixed effects. County fixed effects account for time-invariant factors that vary across counties and may be correlated with mobility patterns such as differences in population size, density, industries, income or geographic features. Time-fixed effects were also included to isolate the response to the state’s stay-at-home order and account for the influence of rises in COVID-19 case counts, media reporting, and nationwide changes in mobility patterns.
States were classified as democratic if the democratic vote share exceeded the republican vote share and republican if the republican vote share exceeded the democratic vote share.
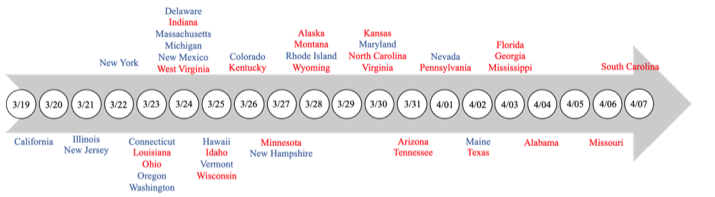
The date on which stay-at-home orders came into effect for each stated was obtained from the New York Times (The New York Times, 2020). The dates of both state-level and county-level orders were taken into account. Overall, as shown in Figure 1, most democratic states implemented stay-at-home orders earlier than republican counterparts. Two states, Utah and Oklahoma, implemented stay-at-home orders at a county-level and are not shown in the figure. Six states did not implement any state or county-wide stay-at-home orders including Iowa, Nebraska, North Dakota, South Dakota, Wyoming, and Arkansas (all of which are republican).
Two separate Difference-in-difference Analyses were conducted. The first DiD measured the differential impact of stay-at-home orders on democratic states versus republican states, excluding the six states that did not implement any stay-at-home orders. In order to ensure robustness of these results and isolate the intervention effects, a second DiD analysis was conducted comparing republican states with stay-at-home orders to the six republican states that did not implement any stay-at-home policy.
Figures 1 and 2 depict the average fraction of users staying at home in states with stay-at-home orders between January 1st, 2020 and May 9th, 2020.
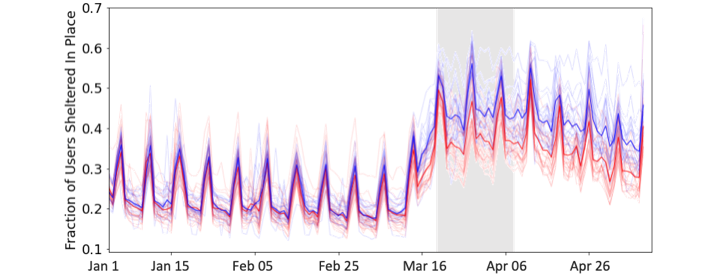
In Figure 2, the blue line represents the fraction of users that stayed at home averaged over all democratic states with stay-at-home orders. The red line represents the fraction of users staying at home averaged over republican states with stay-at-home orders. The frequent spikes visible in the data align with the expected weekly cycle in mobility where people tend to stay close to home on weekends and travel further on weekdays. Before the implementation of stay-at-home orders, between January 1st, 2020 and March 19th, 2020, approximately 22% of users were staying at home. The difference between the fraction staying at home in republican states and democratic states is negligible during this time period. Beginning the 2nd week of March, the fraction of users staying at home rapidly increases. Stay-at-home orders were officially implemented between March 19th and April 7th, 2020 (shaded in grey). Visually, the average percentage of users staying at home in democratic states is much greater than the average percentage of users staying at home in republican states after the intervention. This difference remains relatively constant until May 9th, 2020.
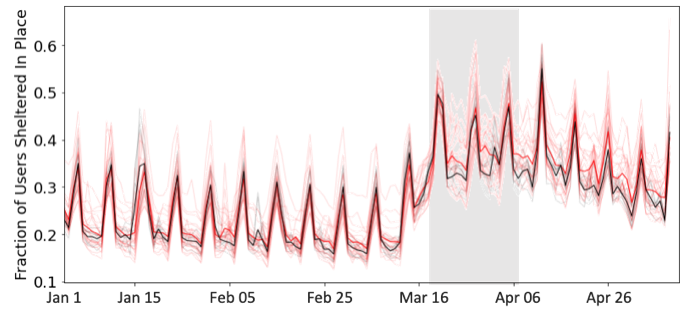
n Figure 3, the black line represents the fraction of users staying at home averaged over all republican states with no stay-at-home orders. The red line represents the fraction of users staying at home averaged over republican states with stay-at-home orders. Before the implementation of stay-at-home orders, between Jan 1st, 2020 and March 19th, 2020, the fraction of users staying at home in republican states that would enact stay-at-home orders is slightly greater than the fraction staying at home republican states that did not receive stay-at-home orders. Beginning the 2nd week of March, the fraction of users sheltering in place increases among most republican states. In the time period following the implementation of these orders, visually the average percent of users staying at home in republican states with stay-at-home orders is greater than the average percent of users staying at home in republican states with no stay-at-home orders. This difference also remains relatively constant until May 9th, 2020. These differences are quantified in the following section.
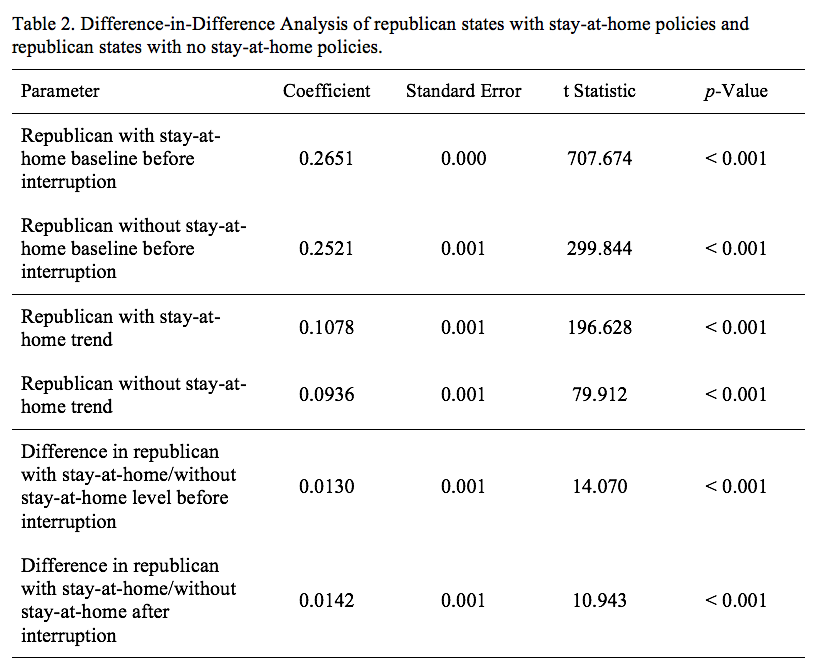
The results for the second DiD analysis comparing republican states that implemented stay-at-home policies to republican states that did not implement stay-at-home policies are shown in Table 2. Before mid-March, the baseline stay-at-home index in republican states that implemented stay-at-home orders was 0.2651 (p<0.001, SE=0.001) and in republican states that did not implement stay-at-home orders was 0.2521 (p<0.001, SE<0.001). The difference in baseline values was 0.013 (p<0.001, SE=0.001). Post implementation of stay-at-home orders, the segmented regression analysis reveals that this difference significantly increased to 0.0142 (p<0.001, SE=0.001).
In this study, we analyzed the differences in response to stay-at-home orders across state political affiliation using aggregated cell-phone mobility data. Post-implementation of state-wide stay-at-home orders, the percent of users staying at home in democratic states increased by 3.29% (p<0.001) more than the percent staying at home in republican states. Further, among republican states, the percent of users staying at home in those that implemented stay-at-home orders increased by 0.12% (p<0.001) more than in those that did not implement any stay-at-home orders. Evidence has showcased a strong and statistically significant relationship between mobility patterns and COVID-19. (Badr et al., 2020) Although we are not able to quantify how this change in mobility impacts infection rates of COVID-19, as of September 2020, 70% of new COVID-19 cases came from republican states.(Deese, 2020) Additionally, survey data show a persistent partisan gap in the level of concern of the pandemic and in mask-wearing. (Gebeloff, 2020) Our results add to the body of literature that suggests that partisan differences may have had a strong influence on human mobility than state and county level stay-at-home policies. These results reflect Anderson, 2020 findings that changes in social distancing behavior are primarily voluntary, and reflect an individual’s belief about disease risk (Andersen, 2020). It has been reported that democratic beliefs regarding the probability of catching COVID-19 without any social distancing is higher than the beliefs held by republicans. (Allcott et al., 2020) Furthermore, strong democrats report beliefs that there will greater number of future COVID-19 cases in the US compared to strong republicans. (Allcott et al., 2020) Finally, related literature has documented that political affiliation impacts other health-related beliefs such as enrollment in health care insurance and perceptions about the safety of vaccines. (Allcott et al., 2020; Lerman, Sadin, & Trachtman, 2017; Long, Chen, & Rohla, 2020; Sances & Clinton, 2019; Suryadevara, Bonville, Cibula, Domachowske, & Suryadevara, 2019).
Druckman et al. finds that polarized environments fundamentally change an individual’s decision-making (Druckman, Peterson, & Slothuus, 2013). Specifically, political polarization leads to a greater impact of party endorsement on individual opinion. Thus, political polarization of the pandemic response perhaps resulted in greater alignment with political ideas based on partisan implications rather than policy attributes. (Bisbee & Lee, 2020) In fact, Druckman also finds that such polarization stimulates greater than normal confidence in less substantive viewpoints. Therefore, statements by President Trump that “America wasn’t built to be shut down”, may have influenced republican states to be less inclined to social distance and follow stay-at-home orders. These differences in stay-at-home behaviors across states with opposing political affiliations may be attributed to the ongoing polarized political atmosphere where party endorsement outweighs evidence-based policy directives.
Firstly, our findings cannot be deemed as causal. Our data was conducted at the ecological level and although an association was seen between state political affiliation and social distancing, our results do not imply causality. Secondly, state political affiliation was determined by the majority voting share of the state and do not necessarily represent all voters’ political affiliation within that state. However, previous research has found associations between the state level sociopolitical environment and public experiences. (Davis, 2020; Fulton, Hollingshead, Karaca-Mandic, & Scheffler, 2015; Rentfrow et al., 2013) Thirdly, the results obtained from this study should be considered in light of cell-phone ownership which may limit the generalizability to the population of the U.S. Mobile phone users are only a subset of the U.S. population and could exclude certain demographics based on socio-economic status or geographic location. However, previous studies have validated the use of this large-scale aggregated human mobility dataset to model mobility patterns in relation to the COVID-19 pandemic. (Grantz et al., 2020; Pepe et al., 2020) Finally, this human mobility dataset does not include sociodemographic information and thus we did not assess how different socioeconomic groups responded to stay-at-home orders. Although this is out of scope of the research question, future studies should evaluate the social factors that influence barriers to social distancing (Grantz et al., 2020; Pepe et al., 2020).
In conclusion, political affiliation may have an influence on level of adherence to social and economic policies related to the COVID-19 pandemic. Bipartisan support for effective evidence-based policies is necessary to ensure the nationwide uptake of these measures, and ultimately reduce the transmission of COVID-19.
Allcott, H., Boxell, L., Conway, J., Gentzkow, M., Thaler, M., & Yang, D. Y. (2020). Polarization and public health: Partisan differences in social distancing during the Coronavirus pandemic. NBER Working Paper(w26946).
Andersen, M. (2020). Early evidence on social distancing in response to COVID-19 in the United States. Available at SSRN 3569368.
Badr, H. S., Du, H., Marshall, M., Dong, E., Squire, M. M., & Gardner, L. M. (2020). Association between mobility patterns and COVID-19 transmission in the USA: a mathematical modelling study. The Lancet Infectious Diseases.
Bisbee, J., & Lee, D. (2020). Mobility and Elite Cues: Partisan Responses to Covid-19.
Brzezinski, A., Kecht, V., Van Dijcke, D., & Wright, A. L. (2020). Belief in science influences physical distancing in response to covid-19 lockdown policies. University of Chicago, Becker Friedman Institute for Economics Working Paper(2020-56).
Cuebiq. (2020). Mobility Insights. Retrieved from https://www.cuebiq.com/visitation-insights-covid19/
Davis, W. (2020). Is There a Difference Between Democrat and Republican States in the Number of Female Students Who Experienced Cyberbullying? Lincoln Memorial University Journal of Social Sciences, 1(1), 1.
Deese, K. (2020). 70 percent of new coronavirus cases are coming from red states. Retrieved from https://thehill.com/homenews/state-watch/515038-70-percent-of-new-coronavirus-cases-are-coming-from-red-states
Difference-in-Difference Estimation. (2020). Population Health Methods. Retrieved from https://www.publichealth.columbia.edu/research/population-health-methods/difference-difference-estimation
Druckman, J. N., Peterson, E., & Slothuus, R. (2013). How elite partisan polarization affects public opinion formation. American Political Science Review, 57-79.
Fulton, B. D., Hollingshead, A., Karaca-Mandic, P., & Scheffler, R. M. (2015). Republican states bolstered their health insurance rate review programs using incentives from the Affordable Care Act. INQUIRY: The Journal of Health Care Organization, Provision, and Financing, 52, 0046958015604164.
Gebeloff, R. (2020). As Covid Has Become a Red-State Problem, Too, Have Attitudes Changed? Retrieved from https://www.nytimes.com/2020/07/30/upshot/coronavirus-republican-voting.html
Grantz, K. H., Meredith, H. R., Cummings, D. A., Metcalf, C. J. E., Grenfell, B. T., Giles, J. R., . . . Kishore, N. (2020). The use of mobile phone data to inform analysis of COVID-19 pandemic epidemiology. Nature Communications, 11(1), 1-8.
Green, T., Tyson, A. (2020). 5 facts about partisan reactions to COVID-19 in the U.S. Retrieved from https://www.pewresearch.org/fact-tank/2020/04/02/5-facts-about-partisan-reactions-to-covid-19-in-the-u-s/
Lerman, A. E., Sadin, M. L., & Trachtman, S. (2017). Policy uptake as political behavior: evidence from the Affordable Care Act. American Political Science Review, 111(4), 755-770.
Liptak, K. V., Maegan; Valencia, Nick; Acosta, Jim. (2020). Trump says he wants the country ‘opened up and just raring to go by Easter,’ despite health experts’ warnings. Retrieved from https://www.cnn.com/2020/03/24/politics/trump-easter-economy-coronavirus/index.html
Long, E. F., Chen, M. K., & Rohla, R. (2020). Political storms: Emergent partisan skepticism of hurricane risks. Science advances, 6(37), eabb7906.
MIT Election Data and Science Lab. (2016). Retrieved from https://electionlab.mit.edu/data#tools
Painter, M., & Qiu, T. (2020). Political beliefs affect compliance with covid-19 social distancing orders. Available at SSRN 3569098.
Pepe, E., Bajardi, P., Gauvin, L., Privitera, F., Lake, B., Cattuto, C., & Tizzoni, M. (2020). COVID-19 outbreak response, a dataset to assess mobility changes in Italy following national lockdown. Scientific data, 7(1), 1-7.
Rentfrow, P. J., Gosling, S. D., Jokela, M., Stillwell, D. J., Kosinski, M., & Potter, J. (2013). Divided we stand: Three psychological regions of the United States and their political, economic, social, and health correlates. Journal of personality and social psychology, 105(6), 996.
Sances, M. W., & Clinton, J. D. (2019). Who participated in the ACA? Gains in insurance coverage by political partisanship. Journal of Health Politics, Policy and Law, 44(3), 349-379.
Suryadevara, M., Bonville, C. A., Cibula, D. A., Domachowske, J. B., & Suryadevara, A. C. (2019). Associations between population based voting trends during the 2016 US presidential election and adolescent vaccination rates. Vaccine, 37(9), 1160-1167.
The New York Times. (2020). See which states and cities have told residents to stay at home. Retrieved from https://www.nytimes.com/interactive/2020/us/coronavirus-stay-at-home-order.html
WHO Coronavirus Disease (COVID-19) Dashboard. (2020). Retrieved from https://covid19.who.int/?gclid=CjwKCAjwq_D7BRADEiwAVMDdHq60YiR3cBvTBmPc6IQzwgHXAF7IYByQTgDheQKZtEotniA9t2o7YBoCgioQAvD_BwE
Wright, A. L., Sonin, K., Driscoll, J., & Wilson, J. (2020). Poverty and economic dislocation reduce compliance with covid-19 shelter-in-place protocols. University of Chicago, Becker Friedman Institute for Economics Working Paper(2020-40).
Siona Prasad is an A.B. candidate in Computer Science and Statistics at Harvard College.
Dr. Yulin Hswen is an Assistant Professor in the Department of Epidemiology and Biostatistics and the Bakar Computational Health Institute at the University of California San Francisco.
HPHR.org was designed by ComputerAlly.com.
Visit HPHR’s publisher, the Boston Congress of Public Health (BCPH).
Email communications@bcph.org for more information.
Click below to make a tax-deductible donation supporting the educational initiatives of the Boston Congress of Public Health, publisher of HPHR Journal.![]()