
Goodman M. Potential economic burden contributing to treatment nonadherence in end-stage renal disease . HPHR. 2022;54. 10.54111/0001/BBB3
Cancer Awareness Months (CAMs) aim to increase public recognition of cancers through education and screening promotion, but their effectiveness is uncertain. This study was designed to characterize the relationship between internet search interest (ISI) of breast, colon, lung, and prostate cancers and screening terms with their respective CAMs to determine CAM effectiveness.
ISI was collected from sampled Google Trends between 2004 and 2021 in June of 2021. The ISI for cancer and cancer screening terms for each respective CAM was compared to ISI for nonadjacent months and across regionality.
Breast CAM (BCAM) was associated with increased ISI for cancer (p>0.001) and cancer screening (p>0.001) terms. Colon CAM (CCAM) was associated with higher cancer term ISI (p=0.004) but had mixed effects on screening ISI. Lung CAM (LCAM) was not associated with change in cancer term ISI (p=0.573) and had mixed effects across screening terms. Prostate CAM (PCAM) was not linked to ISI changes for any associated terms. Regional variation in ISI was found in all cases.
Given its high accessibility and scalability, Google Trends can be used to practically evaluate and guide the strategies of CAM campaigns. Future directions include broadening the geographic scope and comparatively assessing specific CAM campaign strategies.
Cancer represents the second leading cause of death in the United States and globally.1 In the United States in 2021, 1.9 million persons were diagnosed and 600,000 died from cancer.2 Direct cancer-related medical costs in the U.S. were estimated to total $183 billion, an amount expected to increase to $246 billion by 2030.2 Recommended screening practices may reduce breast, colon, lung, and prostate cancer mortality through early detection.3–5 Screening can generate $26 billion of cost-savings annually in the United States.6
Since the federal recognition of October as National Breast Cancer Awareness Month (BCAM) in 1990,7 other months have been recognized as cancer awareness months (CAMs); National Colorectal CAM (CCAM) in March,8 National Prostate CAM (PCAM) in September,9 and National Lung CAM (LCAM) in November.10 These months are designated to increase screening for their cancers through events and public campaigns.11 BCAM has been found to increase screening and diagnosis rates.11,12 Previous research has found that BCAM is effective at generating internet searches for both “breast cancer” and “mammography” during October.12–14 However, effectiveness differed over geographic area.12 Limited studies available on PCAM in the United States found no increase in prostate cancer or screening ISI compared with other months.14–18 The literature is conflicted over the effectiveness of CCAM at generating internet search activity.14,15,17,18 LCAM was not associated with increased ISI, though this was not a consistent finding.15
The Health Belief Model posits that knowledge factors into one’s perceptions about the threat posed by disease and the benefits and barriers to prevention and/or treatment.20 These individual beliefs then interact with cues to action that result in health behavior. Within the context of this model, individual beliefs about the threat posed by cancer are represented by the level of cancer awareness. Cancer screening awareness can be representative of individual perception of the benefits and barriers to screening. CAMs can serve as the cue to action that facilitates the integration of individual beliefs into the decision whether to adopt a health behavior such as cancer screening. Consequently, both cancer risk awareness and cancer screening awareness are needed to result in screening uptake and early detection.
Although BCAM has been linked to increased ISI and screening rates, the effectiveness of other CAMs is less known.11,12 Almost fifty percent of American adults report searching for cancer information, and of those, more than half reported using the internet first.21 ISI in cancer screening has been shown to correlate with cancer screening use, with the strength of the correlation dependent on the type of screening examined.22 ISI has been shown to positively correlate with diagnosis and mortality rates of certain cancers, such as lung and colon cancer.23 Analysis of ISI has proven useful in cancer surveillance for being able to capture data nimbly and at a scale not possible in traditional cancer surveillance programs.22 This study was designed to characterize the relationship between ISI of cancers and related screening test terms with their CAMs with the goal of better understanding CAM effectiveness and geographic variation.
Cancer terms were selected based on lay terminology: “breast cancer,” “prostate cancer,” “lung cancer,” and “colon cancer.” This grouping of queries will be referred to as “cancer terms,” serving as a gauge for cancer awareness. For cancer screening, “mammography” was chosen for breast cancer, “PSA” and “prostate specific antigen” for prostate cancer, “lung cancer screening” and “CAT scan” for lung cancer, and “colonoscopy,” “FIT,” and “FOT” for colon cancer. “FIT” is an acronym for “fecal immunochemical test” and “FOT” refers to fecal occult blood test. The term “cologuard” was not used due to having fewer searches. This latter grouping of queries will be referred to as “cancer screening terms,” which were used to evaluate cancer screening awareness. Terms were selected based on researcher conceptions of popular usage as well as Google Trends data sufficiency. Some terms had insufficient data, such as “low dose CT scans”, for evaluation.
The two types of RRT are peritoneal dialysis (PD) and hemodialysis (HD). HD is a blood and dialysis solution circuit apparatus that filters the blood of patients, typically through the arm, for a few hours about thrice weekly. PD infuses a solution into the peritoneal cavity and collects waste from the blood by using the peritoneal membrane as an exchanger on an ongoing but daily regimen. Each form of RRT has varying costs and burdens to the patient. For example, PD is 22.7% cheaper than HD (or $75,140 compared to $88,750), and lifetime healthcare costs $204,442 for PD compared to $237,795 for HD (Gansevoort, et al., 2013; United States Renal Data System, 2021). Between 2015 and 2016, HD care increased by $2 billion to $26.8 billion, and HD spending per person per year increased by $2,000 to $88,750 (United States Renal Data System, 2018). However, while HD total spending increased by 5.7%, PD spending per person per year increased by 1.4% during the same period of time. This is because HD has more outpatient care, which makes up 66% of its total costs, whereas 51% of PD costs are from dialysate fluids (Eriksson, Neovius, Jacobson, Elinder, & Hylander, 2016). Additionally, HD has high fixed costs from the HD machines and staff, with HD machines costing about $24,000 on average with about a decade life cycle, as well as variable factors including the dialyzers, maintenance, and transportation. PD costs are largely due to variable costs such as the dialysate (Just, et al., 2008). However, PD is generally reserved for those patients who feel comfortable or are independent enough to manage their dialysis care at home and could be trained, as there is a risk of contamination and severe infection. The cost of training could be over $7,000, and training is limited by region (Eggers, 2011). If patients with ESRD were to receive home HD, it would be about 55% cheaper than in-center hemodialysis, though home HD has the same complications as PD, with the additional home dialysis equipment and storage costs and training of over $16,000.
These costs can be tremendous for the ESRD population, for who only 23% to 24% are employed in the United States, and only about 40% are informed of therapeutic alternatives to their current treatment (Van Biesen, van der Veer, Murphey, Loblova, & Davies, 2014; Hallab & Wish, 2018). It may mean many of ESRD costs are from poor patient-informed consent. The lack of true informed consent that patients with ESRD receive may be due to the way dialysis centers discuss PD, as few nephrologists are trained in PD and PD management (Kaplan, 2017). It appears that when patients with ESRD are informed of their choices, more than 50% choose home-based treatments; currently, only about 10% of patients are dialyzed at home (Oliver, et al., 2007; United States Renal Data System, 2021). Of note is that a Taiwanese cross-sectional survey found HD and PD to have similar quality-adjusted life expectancy (Chang, et al., 2016). Another study stated that in-center dialysis provides the highest societal cost and lowest quality of life, whereas kidney transplantation provides the lowest societal cost and highest quality of life (Vanholder, et al., 2017). Additionally, the ESRD Treatment Choices (ETC) Model, which encourages home dialysis and kidney transplantation, was found to have an incremental cost effectiveness ratio of $67,528 per quality-adjusted life year to the United States healthcare system when compared to in-center dialysis (Cha, Zimmerman, & Hansen, 2020). Because of the short-term costs, stress, side effects, and potential lack of informed consent, rates of nonadherence to dialysis have been reported as high as 98% in one study (Childers, Dwosky, Kominski, & Maggard-Gibbons, 2019; Griva, et al., 2014). This rate is both alarming and very concerning as dialysis nonadherence can be deadly. Future studies and immediate action should take place to understand and mitigate the aforementioned factors that could encourage dialysis nonadherence.
The means and standard error of the means for each term were estimated according to the relevant CAM, the months preceding and proceeding that CAM (pre-CAM and post-CAM respectively), and the 9 other months of the year. Following this, an analysis of variance (ANOVA) was performed to test for the significance of the interaction of the national ISI data for each cancer type by year, CAM, search term, and the combination of CAM and search term. In the case of lung and prostate cancers in which major changes in USPSTF recommendations were made between 2004 and 2021, this analysis included examining the significance of the temporal interaction of the period before and after these changes on ISI. The significance of the combined results of this global ANOVA test was a precondition to further pairwise comparisons, thereby serving to prevent the occurrence of type 1 errors within the analysis.27 If the combination of CAM and search term data from the initial ANOVA was found to significantly interact with ISI, a pairwise difference t-test was performed for each term to determine whether CAMs, pre-CAMs, post-CAMs, and other months had significant interaction on ISI relative to each other.
Next, the interaction of individual events on ISI was analyzed. The national cancer term data was sorted chronologically and peaks were identified through the use of Bollinger Bands, a stock market calculation used to compare current and past temporal trends in share price that has been used for healthcare monitoring.28 Months in which ISI was higher than the sum of the 12-month moving average and two 12 months standard deviations were identified as peaks. Geographic ISI data for cancer and cancer screening terms was then examined at a state and metro level. Global tests were used to test for significant differences across each level. Given the significance of these differences, states and metro areas were sorted according to ISI and pairwise difference t-tests were performed to sort these areas into 5 clustered groups with statistically different average values. Terms that were missing more than 25% of state or metro ISI were excluded from analysis at that scale.
Two-sided tests at p=0.05 were used to determine significance when performing analyses of variance and pairwise differences tests.
Figure 1. ISI for breast, colon, lung, and prostate cancer and screening terms by month from 2004-2021
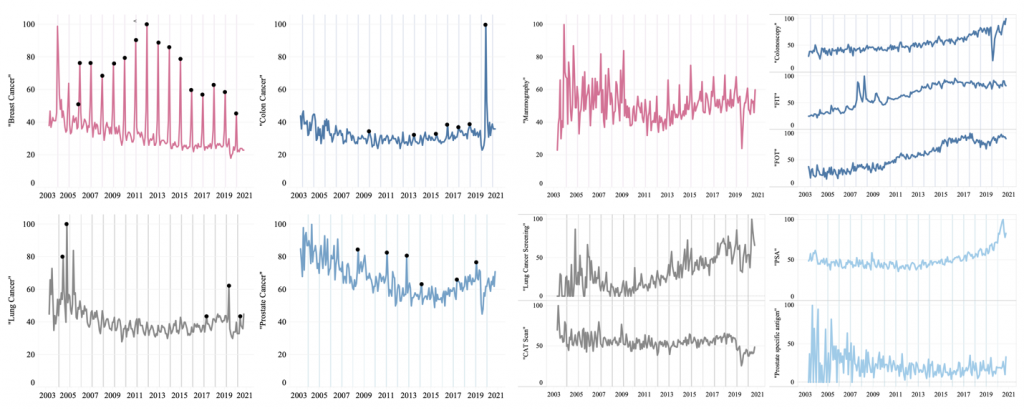
Respective CAMs are shown in shaded lines and data peaks are marked by black dots, which correspond to the correlating events in Table 3. Significant CAM-associated cancer ISI increases were noted for breast and colon cancer, but not lung and prostate cancer. Significant CAM-associated screening ISI increases were noted for “mammography,” “colonoscopy,” and “lung cancer screening.”
Figure 2. Differences in Average Cancer and Cancer Screening Term ISI Respective To CAM
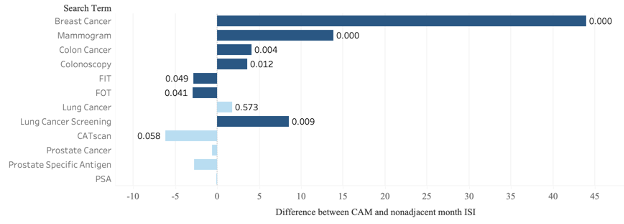
Bars with a positive value indicate that CAM ISI values were higher than those of non-CAMs. Dark bars indicate statistically significant differences. The significance of each difference is labeled with a corresponding P-value. Pairwise difference P-values were not calculated for prostate cancer terms.
Figure 3. American clustered distribution of cancer term ISI by state and metro region
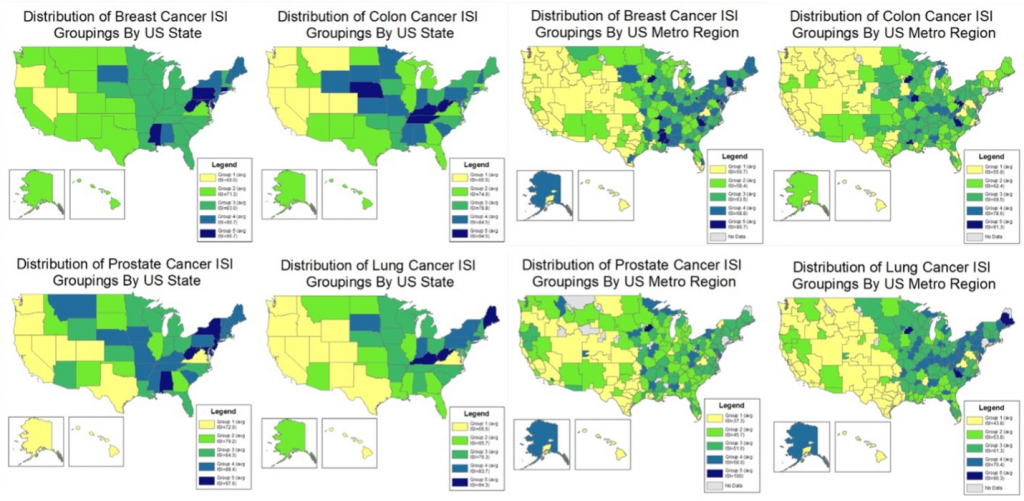
Figure 4. Average Cancer and Cancer Screening Grouping by State
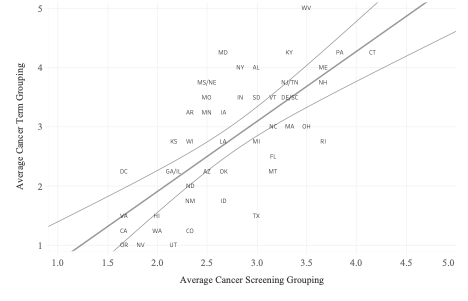
Trendline: y = 1.18214 × x + -0.045425, R2 = 0.0503392, p > 0.0001
Table 1. Effect of Year, Search Term, and Cancer Awareness Month on Cancer ISI.
Cancer and Cancer Screening Terms | Year | Search Term | CAM | Search Term*CAM |
Breast | 0.0056 | 0.0078 | 0.0000 | 0.0000 |
Colon | 0.0000 | 0.0000 | 0.7111 | 0.0002 |
Lung | 0.0594 | 0.0000 | 0.0031 | 0.0016 |
Prostate | 0.0000 | 0.0000 | 0.2534 | 0.9475 |
Significant P values are shown in bold black, and nonsignificant P values are shown in gray.
Table 2. Cancer Term ISI Peaks and Event Correlations.
Breast Cancer | Colon Cancer | Lung Cancer | Prostate Cancer | ||||
Peak Date | Event(s) | Peak Date | Event(s) | Peak Date | Event(s) | Peak Date | Event(s) |
09/2006 | No known event | 03/2010 |
CCAM | 04/2005 | News anchor Peter Jennings’ lung cancer diagnosis revealed32 | 03/2009 | Radio host Don Imus’ and actor David Prowse’s prostate cancer diagnoses revealed38,93 |
10/2006 | BCAM | 03/2014 | |||||
10/2007 | 03/2016 | Administrator Elizabeth Garrett dies of colon cancer29 | 10/2011 | USPSTF PSA testing recommendations change94 | |||
10/2008 | 08/2005 | News anchor Peter Jennings dies of lung cancer33
Actor Dana Reeve’s lung cancer diagnosis revealed34 | |||||
10/2009 | CCAM | 07/2013 | Fish oil linked to prostate cancer40
Talk show host Michael Parkinson’s prostate cancer diagnosis revealed41
Musician Nile Rodgers’ prostate cancer-free status revealed42 | ||||
10/2010 | 03/2017 | ||||||
10/2011 | 02/2018 | No known event | |||||
10/2012 | 02/2020 | Radio host Rush Limbaugh’s lung cancer diagnosis revealed35
Actor Shannen Doherty lung cancer recurrence revealed35 | |||||
10/2013 |
03/2018 | ||||||
10/2014 | 11/2014 | Prostate cancer drug manufacturer Dendreon files for bankruptcy43 | |||||
10/2015 | |||||||
10/2016 | 02/2021 | Radio host Rush Limbaugh and actor Dustin Diamond die of lung cancer36
Politician Bob Dole’s lung cancer diagnosis revealed37 | 01/2018 | Musician Hugh Masekela dies of prostate cancer95
Politician Mitt Romney’s prostate cancer treatment revealed44 | |||
10/2017 | 03/2019 | ||||||
10/2018 | Former football player Mark Gastineau reveals colon cancer diagnosis30 | ||||||
10/2019 | 10/2019 | Rod Stewart’s diagnosis, treatment, and prostate cancer-free status revealed45
Chris Matthews’ prostate cancer treatment revealed46 | |||||
10/2020 | 08/2020 | Actor Chadwick Boseman dies of colon cancer31 | |||||
Data peaks most strongly correlated with CAM in breast cancer (15/16 peaks) and colon cancer (6/7 peaks) and least strongly in lung cancer (0/5 peaks) and prostate cancer (0/6 peaks). Data peaks correspond to the black dots in Figure 1a.
Google Trends data from between 2004 and 2021 (Fig. 1) demonstrate that ISI for related cancer terms is significantly higher during BCAMs (43.943; p<0.001) and CCAMs (4.126; p=0.004) (Fig. 2). No significantly increased ISI was found for “lung cancer” during LCAM (p=0.573). ISI for related cancer screening terms was found to be significantly related to the occurrence of BCAMs, CCAMs, and LCAMs. Concerning cancer screening terms, this interaction denoted significantly increased ISI during CAMs in the case of “mammogram” (13.827; p<0.001), “colonoscopy” (3.606; p=0.012), and “lung cancer screening” (8.554; p=0.009). However, “FIT” (-2.801; p=0.049) and “FOT” (-2.909; p=0.041) experienced significantly decreased ISI during CCAM.
Prostate cancer terms were excluded from pairwise difference analysis as the global ANOVA test, performed to prevent type I errors, found no significant interaction of PCAM and related search terms (Table 1). Additionally, differences in search term impacted ISI across all cancer types. Year affected the ISI of terms relating to every cancer type but lung cancer. BCAM and LCAM were found to affect the ISI of related terms, but this was not the case for CCAM and PCAM.
Peaks in breast and colon cancer term ISI correlated most often with their associated CAM, and peaks in lung and prostate cancer term ISI correlated most often with news of celebrity diagnoses, treatments, and deaths for lung and prostate cancer (Table 2).29–46 Significant interaction was found between August and September 2020, the month of Chadwick Boseman’s death and the following month respectively, and ISI for colon cancer terms (p<0.001). No other peak-based interaction analysis was performed as this was an unexpected finding and would be extrapolative. The USPSTF recommendation changes for prostate cancer in 2012 (p=0.451) and lung cancer in 2013 (p=0.902) did not significantly change ISI for either collection of cancer and cancer screening terms.
Significant differences were found in all terms with sufficient data across state and metro areas (Fig. 3). Five groups of state and metro areas were created for each search term, with significant differences in ISI present across but not within each group. The best states for cancer and cancer screening awareness generally, as reflected by average grouping, were Connecticut, West Virginia, and Pennsylvania (Fig. 4). Bluefield-Beckley-Oak Hill WV, Tri-Cities TN-VA, Charleston-Huntington WV, and Rochester MN-Mason City IA-Austin MN were the best metro areas.
BCAM was the only CAM of those studied found to be effective in its goal to increase both cancer awareness and cancer screening awareness across all examined measures, thereby satisfying each examined individual belief component of the Health Behavior Model. The increased “colon cancer” and “colonoscopy” ISI during CCAM indicates that some measures of awareness are effectively promoted. However, the significant decrease in ISI for “FIT” and “FOT” could mean that this increased awareness is being negated by unintended, counterproductive effects of CCAM. Similarly, higher searches for “lung cancer screening” during LCAM indicate that the month is partially successful in promoting screening uptake, but the unchanged interest for “lung cancer” itself and “CAT scan” screening leaves substantial room for improvement. As PCAM was not associated with changes in ISI generally, much needs to change for this month to attain its potential awareness benefit. The correlation of prostate and lung ISI with news of celebrity cancer diagnoses, treatments, and deaths may indicate a new avenue of social news for cancer awareness groups to focus screening efforts. Additionally, the relative contributions of cancer awareness campaign strategies, cancer incidence, and other geographic contingencies to ISI trends across states and metro areas serve as directions for future research.
ISI data provides instant scalability and comparability regarding geographic data and timespan, allowing for collection and analysis of consistently procured data across subregional and metro areas. The speed of collection of ISI data preserves its relevance post-publication by reflecting the impact of recent changes in screening types, screening recommendations, and CAM awareness campaigns within our findings. The high accessibility of Google Trends data aids replication and comparison of findings across the literature.
The use of Google Trends ISI data to estimate cancer and screening awareness has several advantages over traditional methods of cancer surveillance such as the Behavioral Risk Factor Surveillance System and the National Health Interview Survey.22 These methods tend to be slower, costlier, and rely on self-reporting.22 Notably, traditional methods often present data at an interval too infrequent and with too much lag time to evaluate CAM effectiveness.47,48 This study design seeks to overcome these limitations through publicly-available ISI data, utilizing a cancer screening surveillance method with the advantage of speed and granularity of time. By not relying on self-reported data, ISI reduces the risk that temporal misconceptions and socially pressured responses will factor into results.22,49 This method shows that Google Trends can be used in real-time with no cost to evaluate increased interest related to cancer-related programs at the national, state and metro level.
The strength of BCAM at generating ISI for both cancer and cancer screening may be explained by the fact that breast cancer is the most commonly diagnosed cancer and has the largest survivor population.2,50 Breast cancer’s lower median age at diagnosis may contribute, since younger adults are more likely to use the internet for health information seeking.51,52 Similarly, this data may reflect breast cancer’s higher incidence in women,2 who are more likely to search for health information than men.53 Inversely, this may account for the lack of CAM-associated ISI for prostate cancer and screening.2,50,54,55
In the case of CCAM, increased ISI in “colon cancer” but not consistently for colon cancer screening terms may reflect patient perceptions of higher screening costs and associations of screening with embarrassment, disgust, and violations of privacy.19,56–65 As ISI for “colonoscopy” was significantly higher than for “FIT” and “FOT”, CCAM may be effective at increasing interest for colonoscopy screenings at the expense of other colon cancer screening types. This may be because colon cancer awareness campaigns have often made colonoscopies the single focus of screening promotion.66–68 This leaves out mention of FIT and FOT, underrecognized forms of colon cancer screening.69,70
Lung cancer’s CAM-independent cancer term ISI may be related to social determinants of health, including income and education disparities.71 Although the incidence of lung cancer is higher in those of lower socioeconomic status, it has been shown that some of these individuals are less likely to use online resources for health information seeking due to complexity and lack of interest.54,72–74 Stigmatizing biases that frame lung cancer prevention as a matter of personal responsibility could explain the reduced ISI in lung cancer found in our study.75–78 If cultural stigma is indeed inhibiting lung cancer awareness, the success of BCAM indicates potential for change.79,80 Before feminist and charitable organizations led to mainstream American cultural destigmatization of breast cancer in the early 1990s, traditional American patriarchal norms labeled the disease a fault of women’s behaviours and physiology in addition to associating it with taboo topics such as sexuality and death.79–81 If American breast cancer organizations have managed to raise awareness by deconstructing stigmatizing social norms, overcoming other cancer stigmas could lead to similar benefits for the causes of colon, lung, and prostate cancer awareness.
PCAM’s apparent lack of impact on associated ISI could be related to the fact that, unlike breast, colon and lung cancers, the USPSTF does not clearly recommend prostate cancer screening.39,70,82,83 The lower ISI could be the result of inadequate knowledge of the disease,84 as well as patient privacy concerns.85
Our research methods have several limitations. ISI for various cancers and their screenings does not serve as a comprehensive indicator of screening use, though ISI in cancer screening has been shown to correlate with cancer screening use.22 The decision to rely on ISI data instead of screening rates was based on data accessibility and the delay between patients contacting their health care systems and the actual cancer screening test. As younger adult populations of higher socioeconomic status are most likely to search for health information online, these data may underestimate the cancer awareness of other populations.25,86 Additionally, while ISI screening terms were selected by researchers based in part on conceptions of common usage, selected terms may not represent the queries most often searched to refer to each cancer and cancer screening type.87 The presence of screening terms with multiple meanings, such as “FIT” and “PSA,” may obscure data trends since searches are not amenable to acronym stratification.88 It should be noted that Google is not the only search engine or online platform with cancer-related information on the internet and thus may not be representative of ISI generally.89
Google Trends’ data presents limitations of data transparency, as ISI sample sizes are not publicly available, making the inclusion of sampling error a possibility.26,90 Stephens-Davidowitz and Varian,91 in a guide for social science research published by Google, state that they do not expect that researchers will need more than a single sample. However they offer no corroborating data and the accuracy of this claim has been challenged in other literature.26,91,92 However, the potential of sampling error is reduced given the inclusion of 17 CAM ISI samples in national data and the longer timespan observed. Data comparison is limited because ISI data for a given term is presented as a sampled index of relative search volume over time or region, preventing simultaneous comparison of ISI across all terms or across time and region.22,24
BCAM and CCAMs were significantly associated with increased cancer ISI during their respective months as compared with ISI during nonadjacent months of the year, and there was no change in prostate and lung cancer ISI during their CAMs. Searches for “mammogram,” “colonoscopy,” and “lung cancer screening” were associated with significant increase in ISI during respective CAMs, while ISI for “FIT” and “FOT” were negatively associated with CCAM. In each CAM examined, significant geographical variability was noted. This indicates potential for intra- and inter-comparison of cancer awareness campaign strategies across regions and cancer types to improve screening rates locally and generally, thereby improving rates of early detection and reducing cancer burden. Future directions include international CAM evaluation and comparative evaluation of various CAM campaign strategies to increase screening rates.
This research was partially supported by UNM Comprehensive Cancer Center Support Grant NCI P30CA118100 and the Biostatistics shared resource.
Alex Vanderwiel is a student in the Biology Department at Macalester College. Vanderwiel’s research areas include health surveillance and cancer.
Dr. Diamone Gathers is a Chief Resident in the Department of Internal Medicine and a board
certified, practicing internist at the University of New Mexico in Albuquerque. Her research areas include racial and socioeconomic disparities, cancer prevention, and survivorship. She studied medicine at Virginia Commonwealth University and subsequently completed her Internal Medicine residency at the University of New Mexico.
Dr. Shane Pankratz is a professor in the Department of Internal Medicine at the University of New Mexico, and the Director of the Biostatistics Shared Resource of the UNM Comprehensive Cancer Center. He is a biostatistician with research interests in survival analysis and longitudinal data analysis methods, particularly with application to cancer epidemiology and cancer clinical trials. He received his formal training at Rice University.
Mikaela Kosich is a research scientist in the Biostatistics Shared Resource at the University of New Mexico Comprehensive Cancer Center. Her research interests include health equity, environmental epidemiology, statistical methods in epidemiology. Her training was completed at the University of Pittsburgh.
Dr. Bernard Tawfik is Assistant Professor in Department of Internal Medicine, Division of Hematology Oncology and a board certified, practicing medical oncologist at the University of New Mexico Cancer Comprehensive (UNM CCC) Center, an NCORP-MU site. His research areas include cancer care delivery, quality improvement and health disparities.
HPHR.org was designed by ComputerAlly.com.
Visit HPHR’s publisher, the Boston Congress of Public Health (BCPH).
Email communications@bcph.org for more information.
Click below to make a tax-deductible donation supporting the educational initiatives of the Boston Congress of Public Health, publisher of HPHR Journal.![]()