
Collins-Barnes C, Kopruluoglu B, Guerrero G, Todd L, Bell J, Odom B, Rugless F. Diabetes intervention: a study of the effectiveness of a continuous glucose monitoring (cgm) system and health coaching on type 2 diabetes management. HPHR. 2021;41.10.54111/0001/OO6
There are 34.2 million people in the United States who have diabetes, which is 10.5% of the population.12 88 million people are at an increased risk of developing Type 2 diabetes mellitus (T2DM). 121 The number of new cases related to diabetes is expected to increase by year 2030.20 In 2017, diabetes was the seventh leading cause of death in the United States. 12,19 The incidence and risk for developing diabetes is much higher in certain ethnic groups, including American Indian/Alaska Native, (non-white) Hispanic, and Black (non-Hispanic). 12 Poorly controlled diabetes often contribute to risk factors associated with other coexisting health problems, which leads to debilitating health complications such as heart disease/stroke, blindness and other eye problems, kidney disease, nerve damage, amputations, and
much more.18
Each year, T2DM continues to grow as a public health issue within the United States with it being
the most expensive chronic disease.15 Without the proper healthcare and interventions, the disease itself causes an economic burden on health care spending.20 Annually, $320 billion dollars are spent on services related to T2DM with $237 billion dollars spent on direct medical cost associated with the disease.15Accessible health care services and interventions such as health coaching and follow up care are imperative in managing T2DM. According to the FDA office of Minority Health and Health Equity, there are barriers that exist that prevent the effective management and treatment of T2DM.17 Barriers such as access to health care, socioeconomic status, and cultural attitudes and behaviors exist.16
While advances have been made in T2DM treatment, the prevalence of poorly controlled blood glucose levels are substantial, especially in Shelby County, TN, where 1 in every 3 adults has diabetes.14 Social determinants of health are major factors that contribute to the negative impact on health in Shelby County, TN.13 Methodist Healthcare organization reported that 10% of the population lack transportation, which affects patients’ ability to pay for health care services. 13 An article by Briggs et al. stated that the complications associated with diabetes are experienced on all levels of socioeconomic statuses with the greatest prevalence and complications being on the lower end of socioeconomic status.16
In this study, we will explore the use of implementing a technological device and health coaching into patient care plans, to measure outcomes in patients who are diagnosed with T2DM. The purpose of this study is to evaluate the effectiveness of a continuous glucose monitoring (CGM) device and health coaching on T2DM management. Many barriers exist that affect uninsured and underserved individuals from accessing quality health care and preventing long-term health issues from uncontrolled T2DM. The location of this study took place at Church Health (CH), a faith-based organization that provides affordable integrative health services to the uninsured and underserved populations in Shelby County, TN and surrounding areas. The aim of this study is to measure the effectiveness of a CGM device and health coaching on T2DM.
Using the integrative healthcare services approach, participants in this study met with health care providers and health coaches to receive health education and a Freestyle Libre CGM device to monitor glucose levels. The broader aim of this study was to observe factors that contribute to uncontrolled blood glucose levels and to understand how to manage T2DM and reduce poor outcomes for patients. We hypothesized that (a) the treatment group will improve clinically according to measured outcomes (HbA1c) from improved medication management and that (b) patients will have a better-perceived self-efficacy and a better-perceived quality of life (surveys and PHQ-9).
A prospective case-control study design was used for this study. 78 participants initially enrolled in the study. 52 controls and 26 cases with 36 males and 42 females (54%). Majority of patients were higher risk ethnic groups with 25 participants being African American (32%), 51 Hispanic (65%), and 2 Caucasian (3%). The average age for the intervention group was 49 years, with the average age of the control group being 50 years.
Individuals with uncontrolled T2DM (HbA1c > 9.0) were recruited for an 8-week intervention and matched with a comparison control group. Health-care providers at Church Health initially identified potential participants. Patients were eligible for the treatment group if they were previously diagnosed with T2DM and prescribed insulin (Novolin 70/30, Novolog 70/30, Humulin 70/30). The control group was matched using the same eligibility criteria as previously described with the treatment group. The treatment and control groups were then matched based on sex and age.
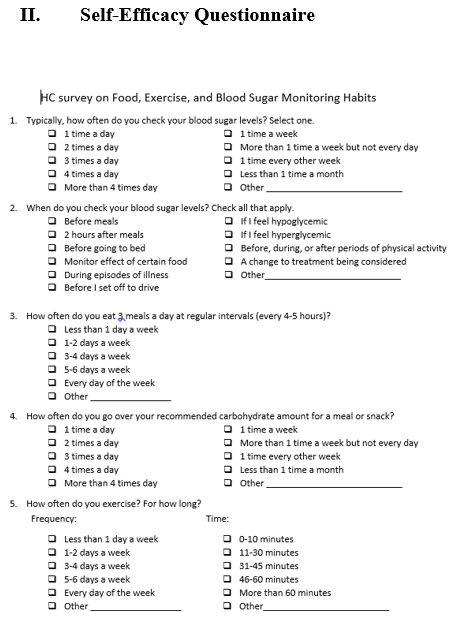
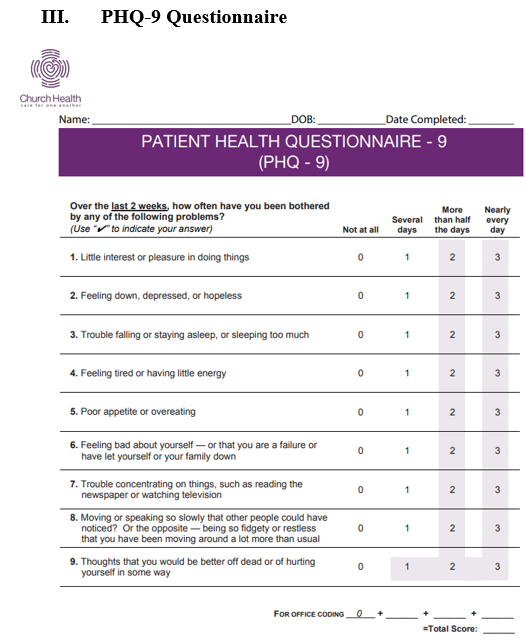
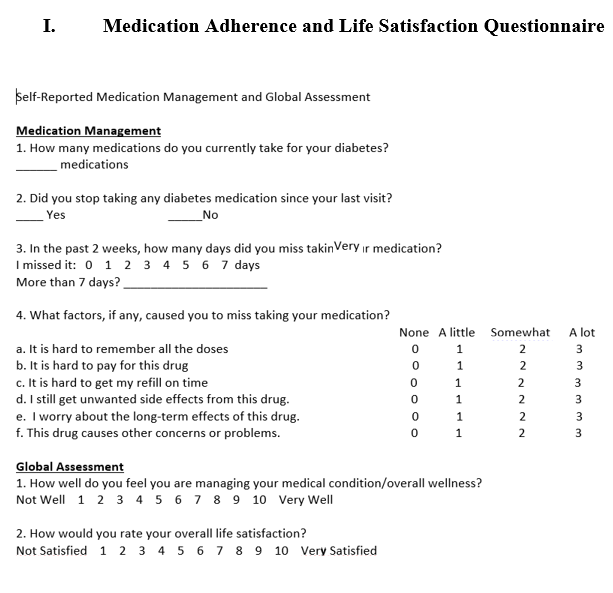
A staff member from Church Health called to schedule an initial appointment with participants, a primary care provider, and a health coach. During the initial visit, the primary care provider discussed the study with the participant and consent was obtained. The initial surveys (global assessment, diabetes medication management questionnaire, and PHQ-9, shown in Figures 1-3) were completed and collected. The participant was given a copy of the informed consent form, a blood sugar log and food diary, a FreeStyle Libre sensor (placed on the upper arm), a session with a health coach, and a 2-week follow-up appointment. The control group and treatment group both had follow up appointments every 2 weeks with a primary care provider. The control group received a health coaching session once a month, while the study group received a health coaching session every 2 weeks until the 8th week.
Health coaching methods included motivational interviewing, goal setting, medication review, and education on diabetes, nutrition, and physical activities. Coach health sessions covered medication adherence, lifestyle and behavioral changes. Self-efficacy questionnaire administered during the health coach session asked questions about food intake, exercise, and blood sugar monitoring. Global assessment questions were asked to measure participants’ attitudes about their management of health and their satisfaction of life. Patient Health Questionnaire- 9 was used to measure the severity of depression in participants. During the health coach session, health coaches used the CGM sensor reports as guidance for consultation with participants to identify patterns and areas of improvement.
At the 2-week follow-up visit, the participants were asked to bring the sensor (which was removed at the appointment), their blood sugar log and food diary, as well as all of their current medications. The provider reviewed the information from the sensor and adjusted the patient’s medication and insulin regimens. A second sensor was placed on the participant’s arm to determine the effect of the medication changes on the patient’s blood glucose levels. Participants then met with a health coach following the visit. The participant was asked to continue recording information in their blood sugar log and food diary. The participant was scheduled for another 2-week follow-up appointment and received a $10 Kroger gift card.
At the next 2-week follow-up (4 weeks since the first sensor was placed), the participants were asked to bring the sensor (which was removed at the appointment), their blood sugar log and food diary, and all of their current medications. The participant would meet with a health coach again, and they would be asked to continue recording in their blood sugar log and food diary. Another 2-week follow-up appointment was scheduled and each participant received a $10 Kroger gift card.
After the 8-week intervention, the patient received another health coach session and a $10 Kroger gift card. The patient was then asked to return for two additional appointments at 3 months and 6 months (from the time first sensor was placed) to follow up on the participant’s diabetes management. At the 3 and 6-month follow-up appointments, the patients met with a health coach, had lab work done, and received a $25 Kroger gift card. Patients also received a phone call from their health coach once a month for a quick follow-up. The 6-month post-test was designed to measure the program’s sustainability. Clinically measured outcomes were retrospectively collected from Church Health’s electronic medical record (EMR) for the control group. HbA1c, glucose, and surveys were collected at baseline, 3 months, and 6 months.
Statistical methods used in the analysis include descriptive statistics including mean, median comparisons, box-plots, histograms, hypothesis tests, and confidence intervals. The software R Studio was used throughout the study. To see the difference between the glucose, HbA1c, blood pressure, PHQ9 levels in the beginning, 3rd month follow up visit, and 6th month follow up visit, we did basic data analysis with descriptive statistics tools. To make sure the values significantly differ, one sided hypothesis tests (ttest at the significance level ∝= 0.05) have been applied, which also include the confidence intervals of differences of the values (beginning, 3rd month visit, 6th month visit). Using a t-test, similar analysis has been performed between different demographics such as patients from different races.
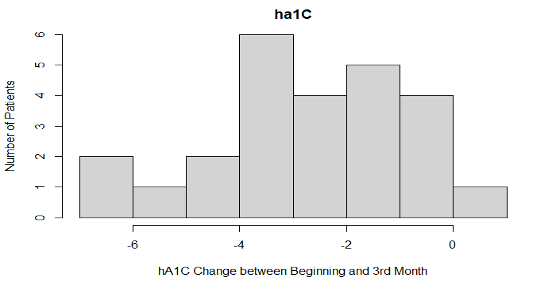
We claimed that HbA1c average significantly decreases in first 3 months. The initial mean = 𝜇0, and the mean at the 3-month visit = 𝜇3 and set up the following hypothesis test:
𝑯𝟎: 𝜇0 − 𝜇3 = 0
𝑯𝑨: 𝜇0 − 𝜇3 > 0
The p-value was 9.132e-09, which is much smaller than 0.05 , so we reject the null hypothesis and conclude that there is strong evidence that the mean of HbA1c values in the case group patients are initially higher than they are in the 2nd visit (3 months later).
We claimed that HbA1c average significantly decreases in 6 months. The initial mean = 𝜇0, and the mean at the 6-month visit = 𝜇6, and set up the hypothesis test as follows:
𝑯𝟎: 𝜇0 − 𝜇6 = 0
𝑯𝑨: 𝜇0 − 𝜇6 > 0
The p-value is 0.0002271. Again, we reject the null hypothesis. There is a significant decrease from the beginning of the study to the 6th month in terms of HbA1c.
We claimed that the HbA1c average significantly increases between 3rd month and 6th month. Using the same notation in the first two tests, the hypothesis test can be written as:
𝑯𝟎: 𝜇3 − 𝜇6 = 0
𝑯𝑨: 𝜇3 − 𝜇6 < 0
The p-value is 0.04854, which is barely less than 0.05, but we still need to reject the null hypothesis and conclude that there is an increase in the trend from the 3rd month to the 6th month.
Also, we wanted to see if the effectiveness of treatment varies by gender. Letting 𝜇𝐹 represent the average change in HbA1c the first three months for female patients and 𝜇𝑀 for male patients, we hypothesized that:
𝑯𝟎: 𝜇𝑀 − 𝜇𝐹 = 0
𝑯𝑨: 𝜇𝑀 − 𝜇𝐹 ≠ 0
The p-value is 0.1, so we fail to reject the null hypothesis. We did not find sufficient evidence that the success of the treatment is better on any sex than it is on other.
Similarly, we want to see if the effectiveness of treatment varies by race. Let 𝜇𝐻 represent the average change in HbA1c the first three months for Hispanic patients, and 𝜇𝐵 for black patients:
𝑯𝟎: 𝜇𝐻 − 𝜇𝐵 = 0
𝑯𝑨: 𝜇𝐻 − 𝜇𝐵 ≠ 0
The p-value is 0.17, so again we fail to reject the null hypothesis. We did not see strong evidence that the success of the treatment is better on one race than the other. Just like HbA1c, the other variables do not vary based on the race and gender.
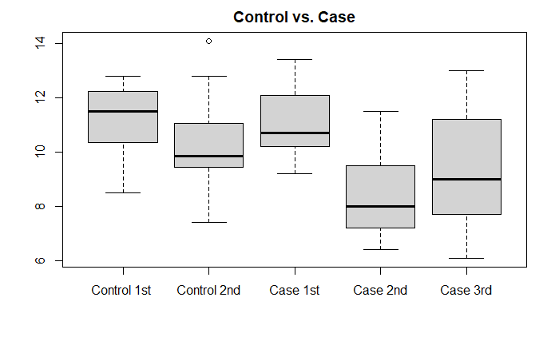
To understand the efficiency of the intervention, we wanted to see if there was a significant difference between HbA1c values in the control group in their 3-month visit and the treatment group in their 3-month visit.

The p-value was 0.001651. Therefore, we can conclude that there is significant difference between HbA1c values of control group and treatment group in their 3-month visit. The 95% confidence interval for the difference was .
Similarly, we looked at if the difference of:

(3-month visit of Control and 6-month visit of Treatment) is significant. The answer turned out to be affirmative as p-value came out as 0.04593. The confidence interval is (0.029, ∞).
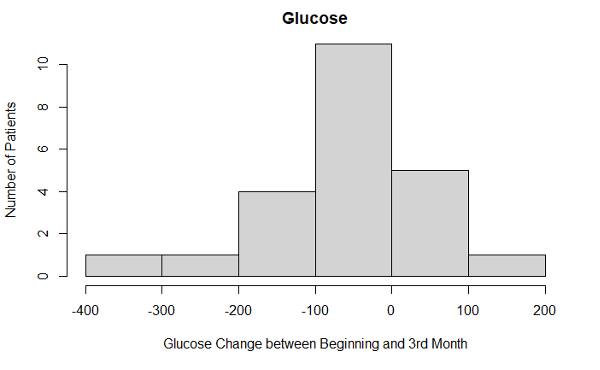
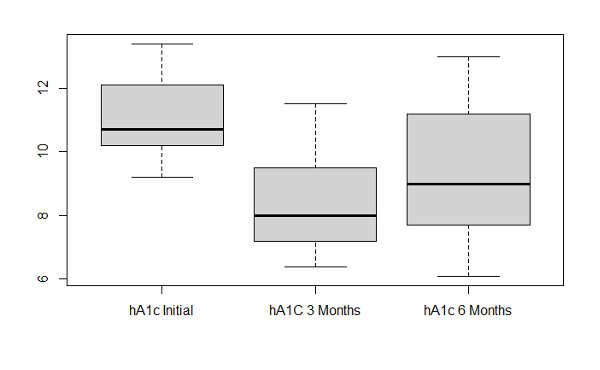
In the first 3 months, the average HbA1c levels decreased (p-value: 9.132e-09) in patients using the CGM device. The mean HbA1c in the intervention group was 11.1% at baseline and it dropped to 8.4% at 3 months (p<0.001). There was a significant difference between individual HbA1c values in the intervention group compared to the control group after 3 months (p=0.001). There was also a decrease in glucose levels (p-value: 0.006072) and PHQ-9 scores (p-value: 0.02256) in participants using the glucose monitoring device. There was no level of significance found in other clinical outcomes measured in the intervention group. We observed an increase in weight with the average being 204.8lbs compared to the average weight of 199.9lbs at baseline. There was an average systolic blood pressure of 136.2 at the 3rd month interval, with the average being 133.1 at the initial visit. Participant’s average diastolic blood pressure increased to 81.6 at the 3rd month compared to the initial diastolic pressure of 78.3. The self-efficacy score average was 8 at the 3rd month with a 0.8 increase from the initial scores, and the life satisfaction average was 8.66 with a slight increase in the 3rd month from an average score of 8.44 in the initial visit.
HbA1c levels (p-value: 0.0002271) slightly increased at the 6 month follow up visit but were still lower than the initial HbA1c average of 11.1. There were no other significant clinical outcomes during the 6-month follow up. We observed a decrease in systolic blood pressure with the average being 132.3 from the initial average of 133.1. Even though there was a small decrease in average blood pressure measurements, it was not enough to show a level of significance. Glucose levels increased with an average of 216.3 among participants. We also observed an increase in the average weight, which was 213.2lbs from the baseline average weight of 199.9lbs. PHQ-9 scores increased with an average of 5.8 compared to a baseline average of 7.4. The self-efficacy average score of 7.75 and life satisfaction average score of 8.38 decreased during the 6-month follow up compared to the baseline averages of 7.2 for self-efficacy and 8.44
for life satisfaction.
Between the 3rd and 6th month follow up only six participants completed the study. Overall, there was a level of significance with HbA1c levels (p-value: 0.04854). HbA1c average levels increased to 9.3 between the 3rd and 6th month, but continued to show a decrease for the 6th month follow up compared to initial HbA1c levels average of 11.1. There was also an increase between the 3rd and 6th month in glucose levels, weight, and PHQ-9 scores. We observed a 4-point decrease in systolic blood pressure between the 3rd and 6th month with the 6th month average being 132.3. Self-efficacy and life satisfaction scores slightly decreased between the 3rd and 6th month. Glucose, PHQ-9 scores, systolic blood pressure, and diastolic blood pressure showed no level of significance between the 3rd and 6th month.
T2DM is a disease that can be prevented with behavioral and lifestyle changes.8 Studies have shown that lifestyle changes can reduce the risk of developing T2DM by 50%.8 In addition, T2DM can be managed using an evidence-based approach to implement interventions in patient care plans.
Interventions include meal planning, nutrition therapy, exercising, and bariatric surgery for weight loss.5Technological interventions such as mobile apps and CGM devices have also shown to be effective in managing T2DM. 6,10 This study was designed to help patients better manage their T2DM with a CGM device and to provide health education on nutrition, exercise, and medication management.
The use of a CGM device and regular visits with a health coach were interventions implemented to determine its effectiveness
on T2DM management.
We hypothesized that (a) the treatment group will improve clinically according to measured outcomes (HbA1c) from improved medication management. The average HbA1c levels and glucose levels decreased from baseline to 3 months. This was the first 3-month follow up visit after patients returned to normal diabetes management without a CGM device and health coaching. During the 6-month follow up visit, HbA1c levels were still lower than the averages in the initial appointment in this study. However, between the 3rd month visit and 6th month visit, the average HbA1c levels and glucose levels increased during that time. Average weight for participants also increased from the 3rd month visit to the 6th month visit. Between the 3-month visit and 6-month visit, participants were to continue self-management of their T2DM without the use of a CGM device and with the education obtained from the health coach session.
We also hypothesized that (b) patients will have a better-perceived self-efficacy and a better-perceived quality of life (surveys and PHQ-9). We hoped that health-coaching sessions would improve participants’ self-efficacy and their life satisfaction scores. During this study, the only measurable outcome that was significant were participants PHQ-9 scores at the 3-month follow up visit. Participants’ life satisfaction scores and self-efficacy scores slightly increased during the 3-month follow up visit. However, the increase in life satisfaction and self-efficacy scores were not significant enough to show a level of significance. During the 6-month visit, PHQ-9, life satisfaction, and self-efficacy scores did not show a level of significance.
It is determined that short term a CGM device and health coaching are effective in managing T2DM. However, we can infer that health coaching in this study is not significant on participants’ better perceived self-efficacy and quality of life. Future research should focus on participants’ retained knowledge about diabetes management in order to determine the effects of health coaching on behavioral and lifestyle changes. Overall, health coaching and the CGM device showed a significant relationship between HbA1c levels and T2DM management. Some confounding variables that may have existed in this study include weight gain in participants and education. After
the 8 week intervention, health coach sessions were an option for participants if they wanted additional coaching. Health coach sessions provided education on diabetes, nutrition, and physical activity. There was an increase in average weight gain in participants between
the 3-month visit and 6-month visit. The increase in weight gain could have had an effect on HbA1c and glucose levels at the 6-month follow up.
The overall purpose of this study was to determine if using a CGM device and health coaching as interventions for uninsured and underserved participants was effective in improving HbA1c levels, glucose levels, self-efficacy, and patient’s quality of life. It is determined that implementing a CGM device and health coaching were short-term interventions for managing T2DM in participants. Specifically, results showed that implementing short-term health coaching and a CGM device demonstrated a significant improvement in HbA1c levels.. Future research efforts should focus on the long-term effects of health coaching and CGM device on T2DM management. To determine the long-term effects of a CGM device and health coaching, future research should focus on the impact of the intervention 6 months and thereafter.
Chasity Collins-Barnes is an intern at Church Health and a recent graduate from the University of New England. She obtained her Master in Public Health on August 31, 2021. Her interests lies within community health and health education.
Dr. Baris Kopruluoglu is an assistant professor of mathematics at Christian Brothers University. Baris is an education professional with a focus in applied mathematics from Auburn University.
Gisela Guerrero was formerly a Wellness Education Coordinator for Church Health. Gisela received her formal training from Brown University.
Rev. Laura R. Todd is a Lead Health Coach/ Wellness Education Coordinator for Church Health. In 2006, Laura R. Todd received her B.S. in Health and Human Performance from Lambuth University in Jackson, TN. In 2008, she received a M.S. in Human Movement Science with a concentration in Health Promotion from the University of Memphis. In 2013, she attended Memphis Theological Seminary where she received her Master of Divinity.
Jacob Bell received his BA in Biology from the University of Mississippi. After obtaining his BA in Biology, he attended the University of Tennessee where he received his PharmD.
Butch Odom is the Director of Behavioral Health at Church Health. He received his Bachelor’s degree in Biology from Bethel University. Butch later received his Master’s in Business Administration from the University of Memphis.
Dr. Fedoria Rugless is the Director of Research for Church Health and Research Assistant Professor at the University of Memphis. She received a Bachelor of Science in Biological and Biomedical Sciences. She received her Ph.D. from the University of Cincinnati College of Medicine.
HPHR.org was designed by ComputerAlly.com.
Visit HPHR’s publisher, the Boston Congress of Public Health (BCPH).
Email communications@bcph.org for more information.
Click below to make a tax-deductible donation supporting the educational initiatives of the Boston Congress of Public Health, publisher of HPHR Journal.![]()