
Zapata J, Zhang C, Malavé-Rivera S, Rodriguez-Diaz C. Geographic differences in access to HIV prevention services and care among sexual minority men in Puerto Rico. HPHR. 2021;30.
DOI:10.54111/0001/DD4
The nature of the HIV epidemic in Puerto Rico (PR) is less understood than in the continental U.S. There is evidence to suggest that there are differences in health care access based on geographical location, such that rural areas are less underserved and have less immediate access to HIV prevention resources. The current study was intended to provide preliminary evidence about the access to HIV prevention services among sexual minority men (SMM) in PR. In this sample, there were no differences between urban and rural-based services for SMM. However, more than half of the sample reported that they have never disclosed their gender identity and sexual practices to a physician.
HIV is a significant public health concern affecting Latinos/Hispanics (henceforth: Latinxs) in the U.S., with infection rates three times higher than among non-Hispanic Whites (Rao et al., 2016). According to a recent epidemiological survey by the Centers for Disease Control and Prevention, Latinxs comprise 26% (or 10,292) of the 40,324 new HIV diagnoses in the U.S. (CDC, 2017). Sexual minority men (SMM) are at particularly high risk for infection, and Latinx SMM comprise nearly 19% of infection rates among all SMM communities (CDC, 2017). Among all Latinxs with HIV, Latinx SMM represent 81% of new infections. HIV positive Latinxs also experience disproportionately poorer clinical outcomes compared with non-Hispanic Whites (Levison et al., 2018).
People in Puerto Rico (PR) are a considerable part of the growing epidemic among Latinx in the U.S. According to a CDC report, PR is one of the top ten jurisdictions with the highest number of cumulative AIDS cases, and HIV prevalence (2016). The incidence of HIV in PR is twice that of the general U.S. population (45 per 100,000), and almost double the overall U.S. Latinx population (CDC, 2014). For a jurisdiction already facing poverty, marginalization, natural disasters, and racism, HIV is not only a notable concern (Rodriguez-Diaz, 2018), but also is an extension or outgrowth of these circumstances. As with HIV diagnoses in the continental U.S., Latinx SMM in PR are significantly impacted by HIV (Rao, 2016). However, despite notable advances in HIV prevention and care – such as the introduction of biomedical pre-exposure prophylaxis (PrEP), insufficient progress has been made in the U.S. to reduce the incidence of HIV among Latinx SMM. With respect to HIV prevention in PR, this is a unique geographical area that is influenced by a myriad of cultural and social factors that impact HIV prevention (Rodríguez-Díaz, 2013).
It has been well documented that people living in rural areas tend to experience less access to health care services (McDaniels et al., 2017; Sarnquist et al., 2011; Veinot & Harris, 2011). Notably, HIV preventive services and people living with HIV who reside in rural areas face greater health care related transportation barriers and provider discrimination (Pellowski, 2013). Discrimination may be a more challenging barrier for HIV prevention due to the sensitive nature of HIV services. For example, Rhodes and colleagues (2010), found that men were unwilling to discuss with providers HIV prevention and testing because they perceived that providers were uncomfortable with their sexual orientation and sexual behaviors. These challenges negatively impact the HIV care continuum, as they reduce testing and linkage to care. Related to transportation, access to employment and affordable income in rural areas in the U.S. have also been shown to reduce access to HIV prevention and health enhancing resources (Pellowski, 2013; Sarnquist et al., 2011).
The U.S. Department of Health and Human Services (HHS) has proposed a new initiative to address these disparities with the goal of reducing HIV incidence in the United States by 90% within 10 years (HHS, 2019; Fauci & Redfield, 2019). The initial phase, coordinated by the HHS office, focuses on the disproportionate occurrence of HIV in rural areas (HHS, 2019). Unfortunately, less is understood about the distribution of HIV prevention services in urban and rural areas in PR. Such information is essential given the aforementioned geographical disparities that directly impact HIV prevention and the HHS initiative to target specific areas that are more vulnerable to HIV infection. The current study is intended to examine the differences inIV prevention care as reported by Latinx MSM in PR and variables related to care engagement.
The current study consists of a cross-sectional online survey of self-reporting HIV-negative SMM, residing in PR. Study procedures were reviewed and approved by the Institutional Review Board (IRB) of the University of Puerto Rico-Medical Sciences Campus.
Data for this study were collected in the summer of 2017 using an online survey platform. Participants were recruited using social media platforms (i.e. Facebook, Twitter, Instagram) and in collaboration with community-based organizations providing HIV care in PR. The online survey instrument covered sociodemographic characteristics, HIV-prevention resources, perceived and internalized stigma, and mental and physical health toward gender identity and sexual orientation. Participation was limited to HIV-negative (self-reported) Latinx men, with at least 18 years of age, living in Puerto Rico, and who reported having had sex with at least one male partner in the last 12 months.
A total of 240 participants who answered the survey were eligible and were included in the analysis. Geographical location was defined by whether the participant was living in San Juan metropolitan area (urban) using self-reported ZIP code for their area of residence (yes=urban, no=rural). The San Juan metropolitan area was defined as the area surrounding the City of San Juan which includes San Juan and its conurbation of the municipalities of Bayamón, Carolina, Cataño, Guaynabo and Trujillo Alto. Figure 1 is a geographical visual representation of PR and our sample distribution of rural and urban areas. Without constituting a whole administrative unit, these municipalities are tied together economically, are the most populous in PR, and have a significant concentration of health services, including HIV services (U.S. Census Bureau, 2019). Rural was defined by including all other zip codes not considered as part of the San Juan metropolitan area. The distributions of sociodemographic variables were summarized by geographical location. Bivariate analysis was used to explore the relationship between geographical location with sociodemographic variables, HIV-prevention resources, and mental and physical health. Chi-square test was used to examine the significance of the relationships. Fisher’s exact test was used instead when assumptions of Chi-square test were not met. Missing values were excluded from the tests. All analyses were conducted with SAS version 9.4.
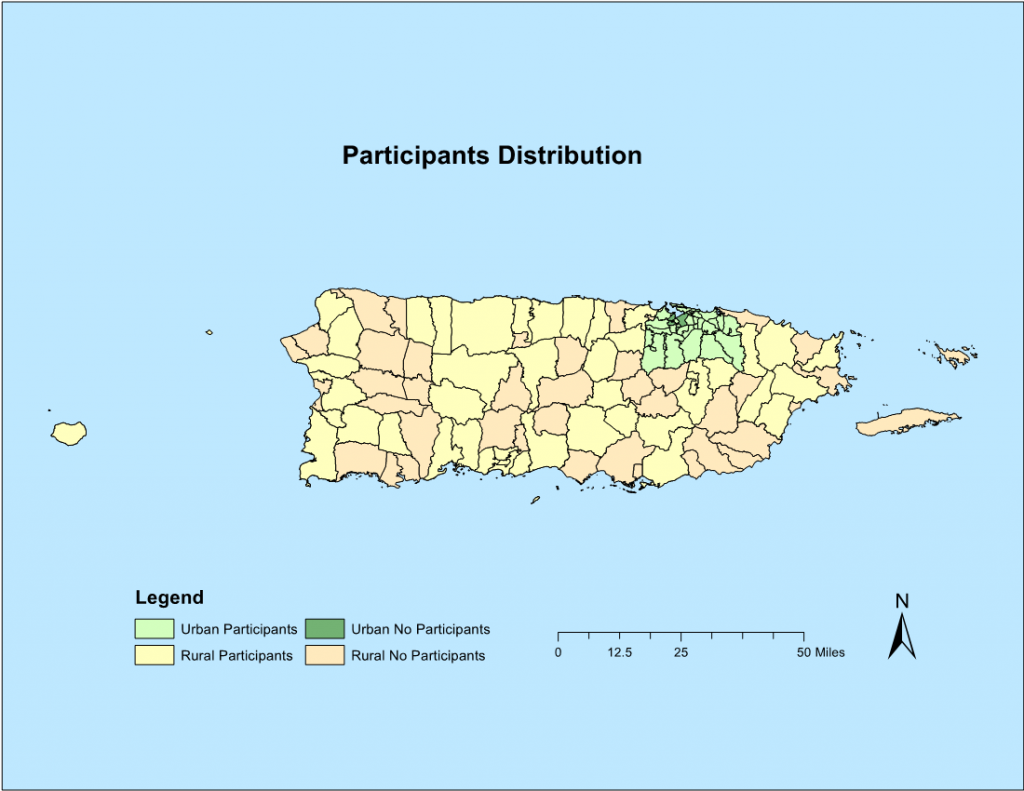
Figure 1: Geographical Urban and Rural Distribution
Sociodemographic characteristics among both rural and urban participants were shown in Table 1. Overall, nearly half (46%) of the participants lived in San Juan area (urban). On average, participants were about 30 years old, and the majority had more than an associate/technical college degree. The vast majority of the participants self-identified as male and gay/homosexual (both over 90%). About half of the sample were not in a relationship and very few (less than 2%) were in a relationship with a woman. Urban participants reported higher education than rural participants (p=0.0522). Urban participants were also significantly more likely to be employed full time (63% vs. 43%) and had significantly higher income than participants who lived in rural area.
Table 1: Sociodemographic characteristics, by geographical location (N=240)
Item | Geographical location | p-value | |
Rural (N, %) | Urban (N, %) | ||
Overall | 129 (53.75) | 111 (46.25) |
|
Age (Mean, SD) | 29.8 (9.9) | 31.6 (9.5) | 0.1462 |
Education |
|
| 0.0522 |
High school or equivalent exam | 13 (10.08) | 4 (3.60) |
|
Some university / college | 25 (19.38) | 12 (10.81) |
|
Associate / technical college degree | 14 (10.85) | 10 (9.01) |
|
Bachelor’s degree | 52 (40.31) | 54 (48.65) |
|
Graduate degree | 25 (19.38) | 31 (27.93) |
|
Employment# |
|
|
|
Employed full time | 55 (42.64) | 70 (63.06) | 0.0016 |
Employed part time | 29 (22.48) | 22 (19.82) | 0.6154 |
Unemployed | 15 (11.63) | 10 (9.01) | 0.5078 |
Student | 42 (32.56) | 30 (27.03) | 0.3512 |
Retired | 7 (5.43) | 1 (0.90) | 0.0719 |
Disabled | 1 (0.78) | 1 (0.90) | 1.0000 |
Income in the last year |
|
| 0.0212 |
None | 7 (5.43) | 4 (3.60) |
|
< $10,000 | 45 (34.88) | 26 (23.42) |
|
$10,000 – $19,999 | 36 (27.91) | 20 (18.02) |
|
$20,000 – $34,999 | 17 (13.18) | 25 (22.52) |
|
$35,000 – $49,999 | 10 (7.75) | 21 (18.92) |
|
$50,000 – $74,999 | 8 (6.20) | 9 (8.11) |
|
> $75,000 | 2 (1.55) | 5 (4.50) |
|
Don’t know | 3 (2.33) | 1 (0.90) |
|
Refuse to answer | 1 (0.78) | 0 (0.00) |
|
In a relationship |
|
| 0.5609 |
Yes, with a man | 61 (47.29) | 56 (50.45) |
|
Yes, with a woman | 2 (1.55) | 0 (0.00) |
|
No | 64 (49.61) | 54 (48.65) |
|
Don’t know | 2 (1.55) | 1 (0.90) |
|
Gender identity |
|
| 0.5141 |
Male | 126 (97.67) | 105 (94.59) |
|
Female | 0 (0.00) | 1 (0.90) |
|
Non-binary | 1 (0.78) | 2 (1.80) |
|
Other | 1 (0.78) | 0 (0.00) |
|
Don’t know | 1 (0.78) | 2 (1.80) |
|
Refuse to answer | 0 (0.00) | 1 (0.90) |
|
Sexual orientation |
|
| 0.5720 |
Other | 1 (0.78) | 0 (0.00) |
|
Heterosexual | 1 (0.78) | 0 (0.00) |
|
Homosexual | 117 (90.70) | 102 (91.89) |
|
Bisexual | 10 (7.75) | 8 (7.21) |
|
I don’t know | 0 (0.00) | 1 (0.90) |
|
Note: # denotes check all items.
Bold p-values denotes statistically significance under α=0.05.
As shown in Table 2, no significant differences were found in HIV prevention resources between rural and urban participants. Less than half of the participants had primary doctors (38% rural, 47% urban); moreover, more than half of them reported that they have never disclosed their gender identity and sexual practices to a physician. Participants in general reported good accessibility to HIV-prevention services, including HIV tests, PrEP, condoms and mental health services. About 12% of the participants did not have health insurance, of which over half reported “cannot afford it” as the reason.
Table 2: HIV-prevention resources, by geographical location (N=240)
Item | Geographical location | p-value | |
Rural (N, %) | Urban (N, %) | ||
Have a primary physician |
|
| 0.1707 |
No | 49 (38.28) | 50 (47.17) |
|
Yes | 79 (61.72) | 56 (52.83) |
|
Disclosed gender identity to physician |
|
| 0.4897 |
No | 71 (56.80) | 57 (52.29) |
|
Yes | 54 (43.20) | 52 (47.71) |
|
Disclosed sexual practices to physician |
|
| 0.5128 |
No | 73 (57.03) | 57 (52.78) |
|
Yes | 55 (42.97) | 51 (47.22) |
|
Place of first HIV test |
|
| 0.8965 |
At a health fair | 21 (16.28) | 15 (13.51) |
|
In the hospital | 6 (4.65) | 4 (3.60) |
|
In a community organization | 38 (29.46) | 33 (29.73) |
|
In an immunology clinic of the Department of Health | 18 (13.95) | 10 (9.01) |
|
In a primary health center | 2 (1.55) | 3 (2.70) |
|
On a routine test with my physician | 4 (3.10) | 3 (2.70) |
|
In a private laboratory | 25 (19.38) | 24 (21.62) |
|
In a research project | 1 (0.78) | 3 (2.70) |
|
Other | 5 (3.88) | 6 (5.41) |
|
N/A | 9 (6.98) | 10 (9.01) |
|
Method finding out the center offers HIV testing (referral) |
|
| 0.8666 |
A health professional recommended the place | 15 (11.63) | 17 (15.32) |
|
A friend recommended it to me | 42 (32.56) | 37 (33.33) |
|
A relative recommended it to me | 4 (3.10) | 3 (2.70) |
|
Promotion on social networks | 9 (6.98) | 5 (4.50) |
|
By Internet | 7 (5.43) | 4 (3.60) |
|
From an advertisement, promotion or booklet | 10 (7.75) | 5 (4.50) |
|
They were doing the test in a public place | 10 (7.75) | 10 (9.01) |
|
I was testing near a gay bar or club | 6 (4.65) | 2 (1.80) |
|
I don’t know | 5 (3.88) | 4 (3.60) |
|
I refuse to answer | 0 (0.00) | 1 (0.90) |
|
Other | 12 (9.30) | 13 (11.71) |
|
N/A | 9 (6.98) | 10 (9.01) |
|
Mental health services accessibility |
|
| 0.6315 |
Totally inaccessible | 6 (9.52) | 6 (9.84) |
|
Inaccessible | 19 (30.16) | 17 (27.87) |
|
Accessible | 25 (39.68) | 30 (49.18) |
|
Totally accessible | 13 (20.63) | 8 (13.11) |
|
PrEP accessibility |
|
| 0.3179 |
Totally inaccessible | 9 (14.29) | 3 (4.92) |
|
Inaccessible | 21 (33.33) | 26 (42.62) |
|
Accessible | 24 (38.10) | 23 (37.70) |
|
Totally accessible | 9 (14.29) | 9 (14.75) |
|
Method of accessing condoms in 3 months# |
|
|
|
Bought from store | 54 (41.86) | 52 (46.85) | 0.4380 |
Sex partner had condoms | 33 (25.58) | 23 (20.72) | 0.3747 |
Given by a friend | 9 (6.98) | 5 (4.50) | 0.4152 |
Given by family | 1 (0.78) | 2 (1.80) | 0.4754 |
Free from a health fair or activity attended | 24 (18.60) | 18 (16.22) | 0.6273 |
Free from school, university or work | 13 (10.08) | 8 (7.21) | 0.4327 |
Free or bought from health professional or health center / clinic | 23 (17.83) | 22 (19.82) | 0.6937 |
Bought from an adult club | 8 (6.20) | 12 (10.81) | 0.1977 |
I don’t use them | 40 (31.01) | 24 (21.62) | 0.1011 |
Do not know | 1 (0.78) | 1 (0.90) | 0.9149 |
Other | 1 (0.78) | 4 (3.60) | 0.1848 |
Currently have health insurance |
|
| 0.9839 |
No | 15 (11.63) | 13 (11.71) |
|
Yes | 114 (88.37) | 98 (88.29) |
|
Reason not having health insurance# |
|
|
|
Cannot afford | 8 (6.20) | 10 (9.01) | 0.4103 |
Lost job | 2 (1.55) | 0 (0.00) | 0.5007 |
Employer did not offer it | 6 (4.65) | 6 (5.41) | 0.7892 |
Do not attend health services | 2 (1.55) | 1 (0.90) | 1.0000 |
Do not know | 0 (0.00) | 1 (0.90) | 0.4625 |
Other | 2 (1.55) | 3 (2.70) | 0.6647 |
Note: # denotes check all items.
No significant difference was found between rural and urban participants regarding mental and physical health status (Table 3). More than 80% of the participants have generally good social supports. On the other hand, substantial proportion of the participants reported at least some degree of depression symptomatology (10%-60%), and more than half were having anxiety symptomatology. Slightly more participants in rural areas than urban reported problems concentrating and unusually less or more active in the last two weeks, which are related to depression symptomatology. Slightly more rural participants reported difficulty relaxing and concerned about health, while less reported nervous, very concerned, and sleep problems. Most of the participants consumed alcohol lightly or moderately and did not have serious drinking problems.
Table 3: Mental and physical health, by geographical location (N=240)
Item | Geographical location | p-value | |
Rural (N, %) | Urban (N, %) | ||
Social Support |
|
|
|
There is a special person who I can share my joys and pains with |
|
| 0.1178 |
Strongly disagree | 3 (2.33) | 4 (3.60) |
|
Disagree | 0 (0.00) | 5 (4.50) |
|
Slightly disagree | 4 (3.10) | 2 (1.80) |
|
Neither Agree nor Disagree | 12 (9.30) | 4 (3.60) |
|
Slightly agree | 12 (9.30) | 12 (10.81) |
|
Agree | 29 (22.48) | 21 (18.92) |
|
Strongly agree | 69 (53.49) | 63 (56.76) |
|
There is a special person who is nearby when I need |
|
| 0.5068 |
Strongly disagree | 4 (3.10) | 4 (3.60) |
|
Disagree | 1 (0.78) | 3 (2.70) |
|
Slightly disagree | 5 (3.88) | 1 (0.90) |
|
Neither Agree nor Disagree | 17 (13.18) | 14 (12.61) |
|
Slightly agree | 15 (11.63) | 15 (13.51) |
|
Agree | 31 (24.03) | 19 (17.12) |
|
Strongly agree | 56 (43.41) | 55 (49.55) |
|
There is a special person in my life who cares about my feelings |
|
| 0.8720 |
Strongly disagree | 7 (5.43) | 6 (5.41) |
|
Disagree | 0 (0.00) | 1 (0.90) |
|
Slightly disagree | 4 (3.10) | 3 (2.70) |
|
Neither Agree nor Disagree | 9 (6.98) | 8 (7.21) |
|
Slightly agree | 12 (9.30) | 16 (14.41) |
|
Agree | 28 (21.71) | 22 (19.82) |
|
Strongly agree | 69 (53.49) | 55 (49.55) |
|
I have a special person who is a true source of consolation for me |
|
| 0.4332 |
Strongly disagree | 4 (3.10) | 10 (9.01) |
|
Disagree | 2 (1.55) | 2 (1.80) |
|
Slightly disagree | 4 (3.10) | 2 (1.80) |
|
Neither Agree nor Disagree | 10 (7.75) | 4 (3.60) |
|
Slightly agree | 13 (10.08) | 13 (11.71) |
|
Agree | 29 (22.48) | 24 (21.62) |
|
Strongly agree | 67 (51.94) | 56 (50.45) |
|
I can talk about my problems with my friends |
|
| 0.1277 |
Strongly disagree | 0 (0.00) | 5 (4.50) |
|
Disagree | 1 (0.78) | 0 (0.00) |
|
Slightly disagree | 5 (3.88) | 1 (0.90) |
|
Neither Agree nor Disagree | 10 (7.75) | 9 (8.11) |
|
Slightly agree | 23 (17.83) | 15 (13.51) |
|
Agree | 29 (22.48) | 24 (21.62) |
|
Strongly agree | 61 (47.29) | 57 (51.35) |
|
I have friends I can share my joys and pains with |
|
| 0.1189 |
Strongly disagree | 0 (0.00) | 4 (3.60) |
|
Disagree | 1 (0.78) | 0 (0.00) |
|
Slightly disagree | 2 (1.55) | 4 (3.60) |
|
Neither Agree nor Disagree | 8 (6.20) | 4 (3.60) |
|
Slightly agree | 23 (17.83) | 13 (11.71) |
|
Agree | 33 (25.58) | 24 (21.62) |
|
Strongly agree | 62 (48.06) | 62 (55.86) |
|
I can talk about my problems with my family |
|
| 0.4083 |
Strongly disagree | 13 (10.08) | 17 (15.32) |
|
Disagree | 9 (6.98) | 4 (3.60) |
|
Slightly disagree | 7 (5.43) | 11 (9.91) |
|
Neither Agree nor Disagree | 19 (14.73) | 19 (17.12) |
|
Slightly agree | 28 (21.71) | 18 (16.22) |
|
Agree | 22 (17.05) | 14 (12.61) |
|
Strongly agree | 31 (24.03) | 28 (25.23) |
|
My friends really try to help me |
|
| 0.1610 |
Strongly disagree | 1 (0.78) | 7 (6.31) |
|
Disagree | 1 (0.78) | 0 (0.00) |
|
Slightly disagree | 1 (0.78) | 0 (0.00) |
|
Neither Agree nor Disagree | 15 (11.63) | 8 (7.21) |
|
Slightly agree | 21 (16.28) | 19 (17.12) |
|
Agree | 36 (27.91) | 28 (25.23) |
|
Strongly agree | 54 (41.86) | 49 (44.14) |
|
I can count on my friends when things go wrong |
|
| 0.3485 |
Strongly disagree | 1 (0.78) | 6 (5.41) |
|
Disagree | 2 (1.55) | 1 (0.90) |
|
Slightly disagree | 4 (3.10) | 4 (3.60) |
|
Neither Agree nor Disagree | 17 (13.18) | 8 (7.21) |
|
Slightly agree | 15 (11.63) | 13 (11.71) |
|
Agree | 29 (22.48) | 25 (22.52) |
|
Strongly agree | 61 (47.29) | 54 (48.65) |
|
I receive the emotional help and support I need from my family |
|
| 0.4910 |
Strongly disagree | 10 (7.75) | 7 (6.31) |
|
Disagree | 3 (2.33) | 7 (6.31) |
|
Slightly disagree | 7 (5.43) | 3 (2.70) |
|
Neither Agree nor Disagree | 13 (10.08) | 17 (15.32) |
|
Slightly agree | 24 (18.60) | 22 (19.82) |
|
Agree | 27 (20.93) | 19 (17.12) |
|
Strongly agree | 45 (34.88) | 36 (32.43) |
|
My family really tries to help me |
|
| 0.4969 |
Strongly disagree | 6 (4.65) | 6 (5.41) |
|
Disagree | 4 (3.10) | 0 (0.00) |
|
Slightly disagree | 2 (1.55) | 2 (1.80) |
|
Neither Agree nor Disagree | 15 (11.63) | 20 (18.02) |
|
Slightly agree | 19 (14.73) | 17 (15.32) |
|
Agree | 34 (26.36) | 29 (26.13) |
|
Strongly agree | 49 (37.98) | 37 (33.33) |
|
My family is willing to help me make decisions |
|
| 0.5310 |
Strongly disagree | 8 (6.20) | 11 (9.91) |
|
Disagree | 4 (3.10) | 2 (1.80) |
|
Slightly disagree | 9 (6.98) | 6 (5.41) |
|
Neither Agree nor Disagree | 14 (10.85) | 18 (16.22) |
|
Slightly agree | 26 (20.16) | 21 (18.92) |
|
Agree | 30 (23.26) | 17 (15.32) |
|
Strongly agree | 38 (29.46) | 36 (32.43) |
|
Depression |
|
|
|
In the last two weeks, have you: |
|
|
|
had little interest or pleasure in doing things |
|
| 0.7915 |
Never | 46 (35.66) | 45 (40.54) |
|
Several days | 60 (46.51) | 48 (43.24) |
|
More than half the days | 13 (10.08) | 12 (10.81) |
|
Almost every day | 10 (7.75) | 6 (5.41) |
|
felt sad, depressed, or hopeless |
|
| 0.6904 |
Never | 40 (31.01) | 40 (36.04) |
|
Several days | 69 (53.49) | 51 (45.95) |
|
More than half the days | 12 (9.30) | 13 (11.71) |
|
Almost every day | 8 (6.20) | 7 (6.31) |
|
had problems sleeping, staying awake, or have you slept too much |
|
| 0.3598 |
Never | 56 (43.41) | 46 (41.44) |
|
Several days | 46 (35.66) | 46 (41.44) |
|
More than half the days | 11 (8.53) | 12 (10.81) |
|
Almost every day | 16 (12.40) | 7 (6.31) |
|
feel tired or have little energy |
|
| 0.4770 |
Never | 42 (32.56) | 32 (28.83) |
|
Several days | 57 (44.19) | 58 (52.25) |
|
More than half the days | 16 (12.40) | 14 (12.61) |
|
Almost every day | 14 (10.85) | 7 (6.31) |
|
have little or excessive appetite |
|
| 0.5313 |
Never | 69 (53.49) | 60 (54.05) |
|
Several days | 40 (31.01) | 34 (30.63) |
|
More than half the days | 12 (9.30) | 14 (12.61) |
|
Almost every day | 8 (6.20) | 3 (2.70) |
|
felt bad about yourself, you are a failure, or you have failed yourself or your family |
|
| 0.6357 |
Never | 67 (51.94) | 61 (54.95) |
|
Several days | 38 (29.46) | 35 (31.53) |
|
More than half the days | 13 (10.08) | 10 (9.01) |
|
Almost every day | 11 (8.53) | 5 (4.50) |
|
had problems concentrating on activities such as reading a newspaper or watching television |
|
| 0.5890 |
Never | 77 (59.69) | 75 (67.57) |
|
Several days | 35 (27.13) | 23 (20.72) |
|
More than half the days | 9 (6.98) | 8 (7.21) |
|
Almost every day | 8 (6.20) | 5 (4.50) |
|
move or talk so slowly that other people may notice or so restless or uneasy that you go from one place to another more than usual |
|
| 0.1987 |
Never | 91 (70.54) | 86 (77.48) |
|
Several days | 24 (18.60) | 20 (18.02) |
|
More than half the days | 10 (7.75) | 2 (1.80) |
|
Almost every day | 4 (3.10) | 3 (2.70) |
|
thought that you would be better off dead or wished to hurt yourself in any way |
|
| 0.9138 |
Never | 113 (87.60) | 96 (86.49) |
|
Several days | 14 (10.85) | 12 (10.81) |
|
More than half the days | 1 (0.78) | 2 (1.80) |
|
Almost every day | 1 (0.78) | 1 (0.90) |
|
Anxiety |
|
|
|
In the last two weeks, have you: |
|
|
|
felt very excited, nervous, or tense? |
|
| 0.3833 |
No | 50 (38.76) | 37 (33.33) |
|
Yes | 79 (61.24) | 74 (66.67) |
|
felt very concerned about something? |
|
| 0.2498 |
No | 40 (31.01) | 27 (24.32) |
|
Yes | 89 (68.99) | 84 (75.68) |
|
felt very irritable |
|
| 0.6113 |
No | 62 (48.06) | 57 (51.35) |
|
Yes | 67 (51.94) | 54 (48.65) |
|
had difficulty relaxing |
|
| 0.4274 |
No | 55 (42.64) | 53 (47.75) |
|
Yes | 74 (57.36) | 58 (52.25) |
|
slept badly or had difficulties sleeping |
|
| 0.7121 |
No | 67 (51.94) | 55 (49.55) |
|
Yes | 62 (48.06) | 56 (50.45) |
|
had headaches or pain in the nape of the neck |
|
| 0.6249 |
No | 68 (52.71) | 55 (49.55) |
|
Yes | 61 (47.29) | 56 (50.45) |
|
had any of the following symptoms: tremors, tingling, nausea, sweating, diarrhea |
|
| 0.4547 |
No | 94 (72.87) | 76 (68.47) |
|
Yes | 35 (27.13) | 35 (31.53) |
|
been concerned about your health |
|
| 0.1977 |
No | 66 (51.16) | 66 (59.46) |
|
Yes | 63 (48.84) | 45 (40.54) |
|
had any difficulty in falling asleep, staying asleep |
|
| 0.5247 |
No | 75 (58.14) | 60 (54.05) |
|
Yes | 54 (41.86) | 51 (45.95) |
|
Alcohol consumption |
|
|
|
Frequency consuming any alcohol |
|
| 0.0717 |
Never | 9 (6.98) | 8 (7.21) |
|
Once a month or less | 41 (31.78) | 32 (28.83) |
|
2-4 times a month | 58 (44.96) | 36 (32.43) |
|
2-3 times a week | 18 (13.95) | 31 (27.93) |
|
4 or more times a week | 3 (2.33) | 4 (3.60) |
|
Amount of alcohol each time |
|
| 0.8682 |
1 to 2 | 33 (25.58) | 34 (30.63) |
|
3 to 4 | 43 (33.33) | 37 (33.33) |
|
5 to 6 | 36 (27.91) | 25 (22.52) |
|
7 to 9 | 14 (10.85) | 12 (10.81) |
|
10 to more | 3 (2.33) | 3 (2.70) |
|
Frequency of drinking 6 or more at a time |
|
| 0.1065 |
Never | 36 (27.91) | 37 (33.33) |
|
Less than once a month | 54 (41.86) | 40 (36.04) |
|
Monthly | 24 (18.60) | 12 (10.81) |
|
Weekly | 15 (11.63) | 22 (19.82) |
|
Daily or almost every day | 0 (0.00) | 0 (0.00) |
|
Frequency of compulsive drinking once started |
|
| 0.8869 |
Never | 100 (77.52) | 89 (80.18) |
|
Less than once a month | 17 (13.18) | 12 (10.81) |
|
Monthly | 6 (4.65) | 7 (6.31) |
|
Weekly | 5 (3.88) | 3 (2.70) |
|
Daily or almost everyday | 1 (0.78) | 0 (0.00) |
|
Frequency of failing responsibilities |
|
| 0.9334 |
Never | 111 (86.05) | 96 (86.49) |
|
Less than once a month | 16 (12.40) | 13 (11.71) |
|
Monthly | 2 (1.55) | 1 (0.90) |
|
Weekly | 0 (0.00) | 1 (0.90) |
|
Daily or almost everyday | 0 (0.00) | 0 (0.00) |
|
Frequency of needing alcohol in the morning after drinking in excess the previous night |
|
| 0.4035 |
Never | 123 (95.35) | 107 (96.40) |
|
Less than once a month | 6 (4.65) | 3 (2.70) |
|
Monthly | 0 (0.00) | 1 (0.90) |
|
Weekly | 0 (0.00) | 0 (0.00) |
|
Daily or almost everyday | 0 (0.00) | 0 (0.00) |
|
Frequency of guilt |
|
| 0.9641 |
Never | 98 (75.97) | 85 (76.58) |
|
Less than once a month | 23 (17.83) | 22 (19.82) |
|
Monthly | 6 (4.65) | 4 (3.60) |
|
Weekly | 1 (0.78) | 0 (0.00) |
|
Daily or almost everyday | 1 (0.78) | 0 (0.00) |
|
Frequency of losing memories |
|
| 0.1485 |
Never | 95 (73.64) | 89 (80.18) |
|
Less than once a month | 28 (21.71) | 22 (19.82) |
|
Monthly | 4 (3.10) | 0 (0.00) |
|
Weekly | 2 (1.55) | 0 (0.00) |
|
Daily or almost everyday | 0 (0.00) | 0 (0.00) |
|
Injury self or others |
|
| 0.7933 |
Never | 118 (91.47) | 101 (90.99) |
|
Yes, but not in the last 12 months | 5 (3.88) | 6 (5.41) |
|
Yes, in the last 12 months | 6 (4.65) | 4 (3.60) |
|
Received concern or recommendation of stop drinking |
|
| 0.8812 |
Never | 113 (87.60) | 99 (89.19) |
|
Yes, but not in the last 12 months | 9 (6.98) | 6 (5.41) |
|
Yes, in the last 12 months | 7 (5.43) | 6 (5.41) |
|
To our knowledge, this is the first exploratory analysis of access to HIV prevention services in PR since the introduction of PrEP in 2012. Experiences related to poverty, racism, and discrimination can disempower people and contribute to HIV risk (Twenge, Catanese, & Baumeister, 2002). As previously stated, geographical differences are likely to account for HIV disparities, particularly in communities with less resources and education. It has been well established that there is a significant variation in testing rates, with rural areas displaying lower rates of testing and diagnosis than urban areas. These disparities extend beyond HIV prevention, and impact the entire health-care continuum, wherein rural areas across the U.S. have less access to educational services and primary health care.
In this sample, there were no differences between urban and rural-based SMM in PR and their access to HIV prevention services. These estimates are different than those reported in a recent population-based sample of Latino MSM in the continental U.S. (Shafer et al., 2017). While the inferences that can be drawn from this study might be limited, this study showed that Latinx SMM in rural areas of PR engage in health care, as demonstrated in their use of HIV testing and PrEP accessibility. This is an important finding as it could serve as an indicator of the success of community-based prevention services in response to the HIV crisis in PR. It may also suggest that there are other factors beyond access to healthcare that limit HIV preventive care.
As previously stated, experiences of discrimination may adversely impact HIV testing and retention of care. It is important to highlight that less than half of men in our sample reported never having disclosed their gender identity and sexual practices to a physician. This has important public health and practice implications as care discrimination and perceived stigma can significantly reduce HIV testing and PrEP-services. While it was not statistically significant, men in urban areas reported greater access to primary care doctors and were more often connected with HIV testing by health care professionals in comparison to men in rural areas. These disparities are further drawn out with the gap in income and education as reported by men in rural areas in PR. It is clear that cost and education can be a major barrier for those trying to access health care prevention and our results highlighted that these differences are more relevant in rural areas in PR. For this reason, it is important to address these barriers to care in an integrated manner, and as set forth by the HHS, additional intervention and advocacy is needed to resolve these discrepancies.
The findings of this study need to be interpreted with caution because of its inherent limitations. The small sample size limited the evaluation of more extensive analysis. It is also important to mention that for the purposes of this study, men were dichotomized into either urban or rural setting based on whether or not they reported San Juan metropolitan area as their area of residence. It is likely that experiences based on rural and urban communities are largely shaped by sociocultural contexts and as such, future investigations should attempt to measure geographical differences with a more exhaustive measure.
In conclusion, this study provides an important first step toward a more comprehensive understanding of HIV prevention among Latinx SMM in PR. From the available research, it is evident that concurrent efforts need to be undertaken to help intensify research and prevention initiatives, including increasing PrEP uptake. As reported by the CDC (2017), out of the 300,000 Latinx men who could benefit from PrEP-use, only 7% were prescribed PrEP in 2016. This discrepancy between level of risk and actual PrEP use is alarming. Especially exigent is enhancing awareness and uptake of Latinx men in underserved communities wherein risk for HIV is higher. Importantly, as illustrated in Table 2, regardless of geographical location, men were less likely to engage in HIV prevention care with their primary care doctor as measured by the site of their HIV test and referral. These data might have important implications concerning implementation of PrEP. Given the requirement for PrEP to be prescribed by a clinician, it is essential to increase primary care-use in PR both in both urban and rural communities to increase PrEP adoption. Future research, both theoretical and practical, should attempt to address HIV prevention through a social justice perspective as many of the barriers discussed in this paper are interconnected and can have major influences on the ability to deliver care services effectively. Findings in this paper can have implications for HIV prevention services in PR specifically, as few studies have directly focused on the impact of HIV and health care services in PR outside of the continental U.S.
Juan Pablo Zapata, MS is currently a graduate student in the Clinical Psychology, PhD program at Marquette University. His primary area of research has focused on the prevention of HIV with biomedical technologies in the Latinx population and on specific social and biomarker(s) relevant to the treatment and prevention of PTSD.
Cheyu Zhang, MPH is currently a research assistant at the George Washington University. Her research mainly focuses on HIV prevention, minority health, and violence.
Dr. Souhail Malavé-Rivera, PhD is a Social-Community Psychologist and Adjunct Professor at the Graduate School of Public Health at the University of Puerto Rico, Medical Sciences Campus. She is interested in the intersection of the social determinants of health (SDoH) associated with HIV transmission, particularly in Hispanic/Latino population.
Dr. Carlos E. Rodriguez-Diaz, PhD is a community health scientist with over fifteen years of experience practicing public health and conducting action research in Puerto Rico, the United States of America, and the Caribbean Region. His work has focused on infectious diseases, particularly HIV care and prevention, as well as sexual health promotion and health equity through actions on the social determinants of health.
HPHR.org was designed by ComputerAlly.com.
Visit HPHR’s publisher, the Boston Congress of Public Health (BCPH).
Email communications@bcph.org for more information.
Click below to make a tax-deductible donation supporting the educational initiatives of the Boston Congress of Public Health, publisher of HPHR Journal.![]()