The Affordable Care Act’s Impact on Community Health Center and Emergency Department Usage in Massachusetts​

By Anna Maloney

Facebook
Twitter
LinkedIn

Citation

Maloney A. The Affordable Care Act’s impact on community health center and emergency department usage in Massachusetts. HPHR. 2021; 28. 

DOI:10.54111/0001/bb14

The Affordable Care Act’s Impact on Community Health Center and Emergency Department Usage in Massachusetts

Abstract

Introduction

The Affordable Care Act increased funding to community health centers in states that chose to expand Medicaid. Massachusetts, a state that expanded Medicaid, has a dense network of community health centers and high volume emergency departments. This paper aimed to identify if the Affordable Care Act increased community health center usage and decreased emergency department usage.

Methods

Data for community health center usage for 2010 – 2014 were obtained through Massachusetts League of Community Health Centers. Data for community health center usage for 2015 – 2018 were obtained through Health Resources and Services Administration. Emergency Department data were obtained through Massachusetts Center for Health Information and Analysis.

Results

The Affordable Care Act increased community health center usage significantly and linearly over the 8-year period. Emergency Department usage did not decrease linearly but did decrease over the 8-year period.

Conclusion

The Affordable Care Act has the potential to decrease emergency department usage through primary and preventative care when Medicaid is expanded. Further research is needed in other states with differing community health center networks.

Background

Community Health Centers (CHC) began in Massachusetts. The first CHC was founded in Dorchester in 1965, to provide primary and preventative care to individuals without health insurance (MLCHC, 2019). Massachusetts now has 285 CHCs providing care to more than 950,000 individuals (MLCHC, 2019). CHCs were created with the goal of providing all levels of care including preventative, primary, and chronic, that is accessible to those who are Medicaid insured or uninsured. When the Affordable Care Act (ACA) was enacted in 2010, it helped expand the number, and services, of CHCs by increasing funds for federally qualified community health centers (FQCHC). Through increasing access to preventative care, another beneficial effect of increasing CHCs may be a decrease in unnecessary or preventable emergency department (ED) usage. Decreased ED usage results in large financial savings from things such as effective management and prevention of chronic conditions. There is a lack of research concerning ED and CHC usage in Massachusetts since the ACA increased funding for FQCHC, and services provided. This literature review will examine FQCHCs, CHCs, and ED’s throughout the United States during the time of the ACA to compare Massachusetts FQCHCs, CHCs, and ED usage.


The price of healthcare has increased dramatically in recent years, totaling 17% of the US gross domestic product in 2017, and is expected to continue rising (Du, 2018). Approximately $8.3 billion of healthcare expenditure is spent on unnecessary ED visits (Premier, 2019), a cost that has more than doubled since the estimated $4.4 billion in 2010 (Weinick, 2010). This is largely due to usage from individuals who do not qualify for Medicaid, but cannot afford to purchase private insurance. The ACA expanded Medicaid eligibility in 2010 by allowing states to determine if individuals living above the federal poverty line could enroll. Though the expansion helped, there were still 500,000+ individuals left without health insurance in 2018 (Tolbert, 2019). Without access to preventative and primary care, along with the lack of urgent care clinics available, individuals are more likely to use the ED as a “safety net” clinic (Nath, 2019).


Medicaid insured individuals without access to a primary care provider taking Medicaid patients have little to no options besides the ED as well. Even though these individuals are insured, the unnecessary usage increases debt. For example, an individual who is Medicaid insured and goes to the ED for any non-emergent cause would only be charged $8 (CMS, 2013). The American College of Emergency Physicians found that approximately 50% of ED admissions go uncompensated, and one in five patients treated in the ED has no form of health insurance (American College of Emergency Physicians, 2013). With the average price of an ED visit in 2014 being $1,533, it is clear why healthcare is accruing so much ED related debt, especially when the primary users are uninsured, and Medicaid insured persons. CHCs and FQCHCs can help reduce the high costs stemming from unnecessary and preventable ED usage, when utilized by the correct populations. Dr. Basu found that only 4-5 less ED visits per provider per year would make CHCs financially neutral, or even beneficial (Basu, 2017). This is a very attainable goal when individuals are given access to primary care providers and able to treat their chronic conditions.


CHCs and FQCHs offer both primary and specialty services including dermatology, maternal and child health services, smoking cessation programs, family medicine, among others to provide effective primary, secondary, and tertiary prevention and decrease preventable ED usage (MLCHC, 2019). The services offered at a CHC vary depending on a populations’ needs in a given area, though most clinics provide similar preventative programs such as HIV screening and counseling, along with nutrition counseling. These programs are consistent among CHCs due to the common health problems associated with populations experiencing more social determinants of health. The ACA increased funding for these types of prevention programs, and recent studies have found that these community and case-management focused interventions help lower hospital admissions, readmissions, and ED usage (Berkowitz, 2018; Raven, 2016; Grazioli, 2019). One study found that within 3 years of states increasing funding to CHCs, uninsured ED visits decreased by 40%, saving hospitals an estimated $14 million (Smith-Campbell, 2019). Proper management of chronic conditions through CHCs can significantly reduce preventable ED usage and accrue large cost savings. Another study focusing on end stage kidney disease discovered when patients receive dialysis on a routine basis it costs $207,759 less per person than an individual using the ED for emergency only dialysis (Sheikh-Hamad, 2007).


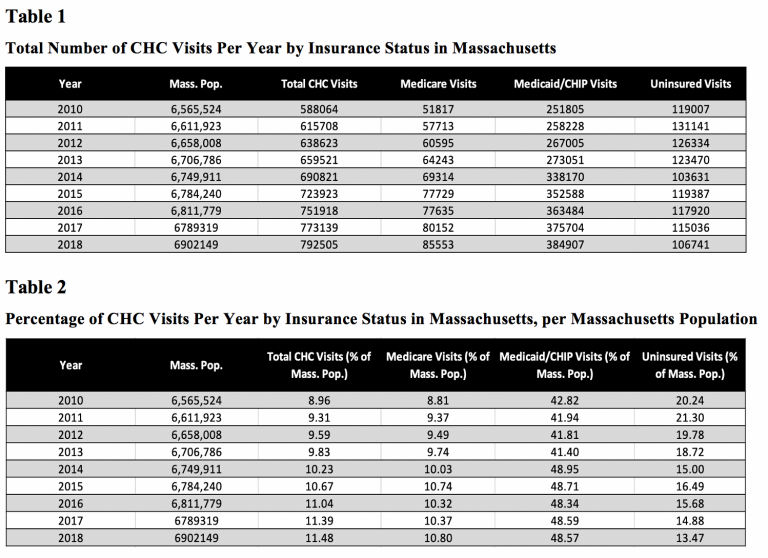
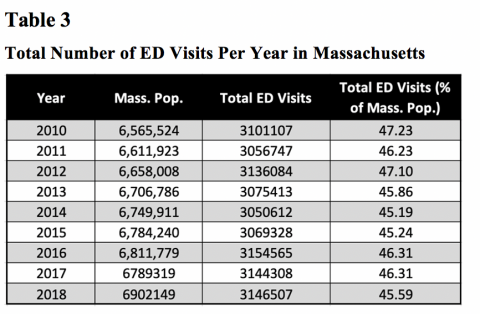
It is important to have a large network of CHCs providing a range of services as well. The individuals utilizing these clinics are primarily of low socioeconomic status, so barriers such as access to transportation must be considered. Massachusetts’s 285 CHCs are spread across the state consistently, with the number of CHCs growing. The Greater Boston area has a higher number of CHCs than other regions of the state due to the denser population and greater health needs. A high concentration of CHCs is necessary to help prevent and decrease unnecessary and preventable ED usage. A study was conducted in California to test if increased access to CHCs truly decreased ED usage, and they found increased CHC access and concentration in a geographic area was in fact associated with lower rates of uninsured ED usage (Nath, 2016). Because FQCHCs are funded through the ACA and other government waivers, they are required to report their health statistics publicly including usage by age, race, insurance type, and service (HRSA, 2017). Clear trends are visible for increasing CHC usage in Massachusetts since the ACA, but a relationship analyzing CHC use and corresponding ED use before and after the ACA in Massachusetts has yet to be established. Recent studies analyzing the same question, such as the 2019 Nath study for California, found that increasing FQCHCs in a geographic area decreases ED usage 26-35% in uninsured individuals (Nath, 2019). This paper aims to identify if there is a statistical significant increase of CHC usage and decrease of ED usage after the ACA came into effect in Massachusetts.

Methods

The purpose of this study is to analyze if the Affordable Care Act increased CHC usage and decreased ED usage. A secondary question in this study is to analyze if CHC usage increased by Medicaid/CHIP insured individuals. In order to identify trends and their significance, linear regression was calculated across the years 2010 to 2018 for CHC usage and ED usage. Linear regression was chosen due to the ability to model the relationship between the two variables year and total number of visits for ED and CHC, along with year and usage by insurance type for CHCs. The statistical significance for the relationship was calculated as well with a p value of <0.05 being statistically significant.


Secondary quantitative data from Massachusetts League of Community Health Centers, Health Resources and Services Administration, and Massachusetts Center for Health Information and Analysis were used to conduct linear regression calculations. CHC data include the variables total usage by center, Uninsured usage, Medicaid/CHIP usage, Medicare usage, and Other Third-Party insurance usage. ED data include total number of visits by hospital by year

Literature Review

The literature review was conducted using National Center for Biotechnology Information’s PubMed database. Search terms for the literature review included “community health center”, “CHC”, federally qualified health center”, “federally qualified community health center”, “emergency department”, “ED”, “affordable care act” AND “CHC”, “ACA” AND “CHC”, “ACA” AND “emergency department”.

Community Health Center Data 2010 – 2014

Health Resources and Services Administration (HRSA) and Massachusetts League of Community Health Centers requires all data for FQCHCs be reported at the end of each fiscal year. Data for CHC usage in Massachusetts for the years 2010 through 2014 were obtained through Massachusetts League of Community Health Centers archives. Variables included total usage, race, ethnicity, age, and insurance status and provider (i.e. Medicare, Medicaid/CHIP, or other third-party insurer) by year. Data for 36 CHCs were available for the years 2010-2013, and data for 37 CHCs were available for the year 2014.

Community Health Center Data 2015 – 2018

Data for CHC usage in Massachusetts for the years 2015 through 2018 were publicly available through the HRSA website. Variables for these years were the same: total usage, race, ethnicity, age, and insurance status and provider (i.e. Medicare, Medicaid/CHIP, or other third-party insurer) by year. Data for 39 CHCs were available for the years 2015 to 2018.

Emergency Department Data 2010 – 2018

Data for ED visits were obtained through the Massachusetts Center for Health Information and Analysis, which collects data annually through Massachusetts payers and providers. This data included the number of visits per hospital for the state of Massachusetts by year, for the years 2010 to 2018.

Data Management

CHC variables in datasets from 2015 – 2018 were given in percentages by CHCs. All variables percentages were converted into whole numbers by changing percentages to decimal numbers, then multiplying decimals by the total population number given in each dataset. The numbers were totaled for each variable for the given year. These totals were converted back to percentages so that variables could be compared across years to analyze CHC usage by a given variable to control for differences in population and number of centers reporting data. CHC variables in datasets 2010-2014 were given in whole numbers and percentages, so conversions did not need to be performed.

Linear Regression

Linear regression was calculated for ED use and CHC use using Microsoft Excel and SPSS. Linear regression for total ED and CHC usage were calculated for years 2010-2018, 2012-2015, and 2014-2018 to analyze the relationship between usage of the ED and CHC by year, for statistical significance, and for trends in use for significant years pertaining to ACA provisions. Linear regression was also calculated for CHC usage by insurance type for the years 2010-2018 to analyze if there was statistical significance in trends and a relationship between insurance type and CHC usage.

Results

The ACA increased CHC usage significantly but did not have a significant effect on ED use as hypothesized. CHC usage between the years 2010 and 2018 increased for total number of visits, Medicare insured, and Medicaid insured individuals with corresponding p-values of 5.63 x 10⁻⁷, 0.002, and 0.014, with a p-value of ≤ 0.05 being statistically significant. CHC usage from 2010 – 2018 decreased significantly for uninsured individuals with a p-value of 0.0008. ED usage varied greatly across the years 2010 to 2018, 2012-2015, and 2014-2018 with corresponding p-values of 0.33, 0.35, and 0.34, with a p-value of ≤ 0.05 being statistically significant.

Table 1 and 2 show the total number of CHC visits in Massachusetts by insurance status for the years 2010-2018. Table 1 shows CHC usage in raw numbers by year for Medicare, Medicaid/CHIP, and uninsured individuals. Table 2 shows CHC usage in percentages calculated using the Massachusetts population for a given year, by insurance status, which allows for comparison across years. Total visits, Medicare, and Medicaid insured persons visits rise consistently with increases of 2.52%, 1.99%, and 5.75%.
Table 3 shows the total number of ED visits per year in Massachusetts from 2010-2018. The total visits are shown in raw numbers, and in percentages calculated from the Massachusetts population of the given year to allow comparison across years. The percent of the population using the ED decreases 1.91% from 2012-2014 and remains level until 2016 when usage increases again.
Figure 1 shows Linear Regression for CHC usage from the years 2010 – 2018. Linear regression was calculated using the percentages of total CHC usage calculated from total usage numbers and the Massachusetts population. An R square value of 0.988 and p-value of 5.63 x 10⁻⁷ were found, indicating that there is a strong, statistically significant increasing trend of CHC usage over the 9-year period.
Figure 2 shows Linear Regression for CHC usage from Medicaid/CHIP insured individuals from the years 2010 – 2018. Linear regression was calculated using the percentages of Medicaid/CHIP insured usage calculated from total usage numbers and the Massachusetts population. An R square value of 0.673 and p-value of 0.014 were found, indicating that there is a moderate, statistically significant increasing trend of Medicaid/CHIP insured individuals utilizing CHC’s over the 9-year period.
Figure 3 shows Linear Regression for ED usage from the years 2010 – 2018. Linear regression was calculated using the percentages of total ED usage calculated from total usage numbers and the Massachusetts population. An R square value of 0.10 and p-value of 0.33 were found, indicating that there is no trend or statistical significance of ED usage over the 9-year period. To further analyze ED usage, the years were broken down further based on when ACA provisions were enacted and revoked.
Figure 4 shows Linear Regression for ED usage from the years 2012 – 2015. Linear regression was calculated using the percentages of total ED usage calculated from total usage numbers and the Massachusetts population. An R square value of 0.69 and p-value of 0.35 were found, indicating that though it is not statistically significant, there was a moderate decrease in ED usage between the years of 2012 – 2015.
Figure 5 shows Linear Regression for ED usage from the years 2014 – 2018. Linear regression was calculated using the percentages of total ED usage calculated from total usage numbers and the Massachusetts population. An R square value of 0.75 and p-value of 0.34 were found.

Discussion

ED usage decreased significantly between 2010 and 2011, and again between 2013 and 2014 as predicted due to the ACA’s implementation. This coincides with the statistically significant increase in usage for CHC’s during these time periods. Although CHC usage increased significantly each year, the opposite decreasing trends were not seen consistently for ED usage. There were significant increases in ED usage between 2011 and 2012, then again between 2015 and 2016. However, even with significant spikes in usage, the line of best fit shows that the overall trend of ED usage between 2010 and 2018 was decreasing.

Spikes in ED Usage Between 2010 and 2018

There are two notable increases in ED usage; between the years 2011 and 2012 and between 2015 and 2016. Though the explanation for these spikes are not certain, there are several plausible causes. Between 2011 and 2012, the number of people immigrating to Massachusetts from foreign countries increased by 5,466 people from the previous year (U.S. Census Bureau 2016). This immigration surge may help explain the increase in ED usage. Between 2015 and 2016 there was not an immigration surge, but there was an increase in both out of pocket maximum payments and deductibles raising as much as $500 (Thomas, 2016). The increase in costs to consumers may have caused less residents to purchase and insurance causing an increase in preventable ED usage.

Few studies have analyzed the relationship between the ACA, CHC usage, and ED usage. Studies such as Yanuck et. al. found the ACA helped decrease ED usage for psychiatric related events (Yanuck, 2017), while Ruohua et. al. found that preventable ED usage is due mainly to Medicaid insured individuals (Ruohua, 2017). Other studies have found there are significant decreases in hospital spending when patients are provided with routine dialysis instead of emergency only dialysis, resulting in $207,759 less per person annually (Sheikh-Hamad, 2007). These results are comparable to the results found here, as Medicaid enrollment and CHC usage increased while ED usage eventually decreased.

Strengths

There are multiple strengths for this study. The results are novel as no study has examined the relationship between the ACA, CHC usage, and ED usage. This information can now be used for other states to consider when determining whether to expand Medicaid and increase CHC funding. The study also had a very large sample size due to the data collection methods of Massachusetts Center for Health Information and Analysis and Health Resources Services Administration. This helps validify the significance of the results.

Limitations

There are several limitations for this study. The first limitation is the variations in ED data available for each year.  Most hospitals did not report their admission numbers for every year. Though the numbers were converted into percentages based off the Massachusetts population for that given year, the percentages could be more accurate if all hospitals reported their number every year. The second limitation is that ED data do not include admissions by insurance status, so it is impossible to know which individuals (i.e. uninsured, Medicaid insured, privately insured, etc.) are using the ED most. If insurance status were provided it would help solidify the relationship between the ACA, CHC usage, and ED usage.

Implications and Future Directions

This study helped identify the strengths of the ACA. A significant portion of healthcare costs are spent on treating acute cases that are preventable. The ACA increased the number of individuals utilizing CHCs, and appears to have helped increase the number of uninsured individuals gain Medicaid coverage. Although the path was non-linear, there does appear to be an overall decrease in ED visits as well, which could lead to large costs savings. This should be considered for states that chose not to expand Medicaid under the ACA and are experiencing higher ED admission rates. To prevent unnecessary ED visits and cut admission-related costs, states should expand the number of CHCs available, increase services provided, and expand Medicaid coverage. Ideally, this will increase primary, secondary, and tertiary prevention to properly manage chronic illnesses and prevent new conditions from developing.

Future studies should examine the relationship between CHC usage and ED usage in other states. Massachusetts may be an outlier as CHCs began in Massachusetts, and there is an extensive network and funding system available for them. Examining states with less available CHCs that also expanded Medicaid would be interesting to identify the ACAs impact in a variety of settings. It would also be helpful to analyze CHC usage and ED usage before and after the ACA in states that chose not to expand Medicaid. This would help strengthen the causality of the relationship between the ACA and the increase in CHC usage along with decrease in ED usage.

Lorem ipsum dolor sit amet, consectetur adipiscing elit. Ut elit tellus, luctus nec ullamcorper mattis, pulvinar dapibus leo.

References

  1. American college of Emergency Physicians. (2013). Costs of Emergency Care. Retrieved from http://newsroom.acep.org/2009-01-04-costs-of-emergency-care-fact-sheet#footnote_v
  2. Agency for Healthcare Research and Quality. Emergency Room Services-Mean and Median Expenses per Person With Expense and Distribution of Expenses by Source of Payment: United States, 2014. Medical Expenditure Panel Survey Household Component Data. Generated interactively. (February 15, 2020)
  3. Basu, Sanjay, Jack, E., H., Arabadjis, Sophia, . . . Phillips. (2017, February 01). Benchmarks for
  4. Reducing Emergency Department Visits and Hospitalizations Through Community Health Workers Integrated Into Primary Care. Retrieved from https://www.ingentaconnect.com/content/wk/mcar/2017/00000055/00000002/art00012?crawler=true&mimetype=application/pdf
  5. Berkowitz SA, Parashuram S, Rowan K, et al.Association of a Care Coordination Model with Health Care Costs and Utilization: The Johns Hopkins Community Health Partnership (J-CHiP). JAMA Netw Open. 2018;1(7):e184273. doi:10.1001/jamanetworkopen.2018.4273
  6. Du, J. Y., Rascoe, A. S., & Marcus, R. E. (2018). The Growing Executive-Physician Wage Gap in Major US Nonprofit Hospitals and Burden of Nonclinical Workers on the US Healthcare System. Clinical orthopaedics and related research476(10), 1910–1919. https://doi.org/10.1097/CORR.0000000000000394
  7. Grazioli, V. S., Moullin, J. C., Kasztura, M., Canepa-Allen, M., Hugli, O., Griffin, J., Vu, F.,
  8. Hudon, C., Jackson, Y., Wolff, H., Burnand, B., Daeppen, J. B., … Bodenmann, P. (2019). Implementing a case management intervention for frequent users of the emergency department (I-CaM): an effectiveness-implementation hybrid trial study protocol. BMC health services research19(1), 28. doi:10.1186/s12913-018-3852-9
  9. Health Resources and Services Administration. (2018). 2018 Health Center Profile. Retrieved from https://bphc.hrsa.gov/uds/datacenter.aspx?q=d&year=2017&state=MA#glist
  10. Massachusetts League of Community Health Centers. (2019). Community Health Centers. Retrieved from http://www.massleague.org/CHC/Overview.php
  11. Medicaid. (2013). Cost Sharing Out of Pocket Costs. Retrieved from https://www.medicaid.gov/medicaid/cost-sharing/out-of-pocket-costs/index.html
  12. Nath, J. B., Costigan, S., Lin, F., Vittinghoff, E., & Hsia, R. Y. (2016, October 01). Federally Qualified Health Center Access and Emergency Department Use Among Children. Retrieved fromhttp://pediatrics.aappublications.org/content/138/4/e20160479.long
  13. Nath, J. B., Costigan, S., Lin, F., Vittinghoff, E., & Hsia, R. Y. (2019). Access to Federally Qualified Health Centers and Emergency Department Use Among Uninsured and Medicaid-insured Adults: California, 2005 to 2013. Academic emergency medicine : official journal of the Society for Academic Emergency Medicine26(2), 129–139. https://doi.org/10.1111/acem.13494
  14. Premier Inc. (2019, February 7). Premier Inc. Identifies $8.3B Savings Opportunity in the ED with More. Retrieved from https://www.premierinc.com/newsroom/press-releases/premier-inc-identifies-8-3b-savings-opportunity-in-the-ed-with-more-preventative-and-coordinated-ambulatory-care
  15. Raven, M. C., Kushel, M., Ko, M. J., Penko, J., & Bindman, A. B. (2016, October). The Effectiveness of Emergency Department Visit Reduction Programs: A Systematic Review. Retrieved from https://www.ncbi.nlm.nih.gov/pubmed/27287549
  16. Sheikh-Hamad, D., Paiuk, E., & Wright, A. (2007, May). Care for immigrants with end-stagerenal disease in Houston: A comparison of two practices. Retrieved from https://www.researchgate.net/publication/6338193_Care_for_immigrants_with_end-stage_renal_disease_in_Houston_A_comparison_of_two_practices
  17. Smith-Campbell, B. (2005, February 10). Emergency Department and Community Health Center Visits and Costs in an Uninsured Population. Retrieved from https://sigmapubs.onlinelibrary.wiley.com/doi/abs/10.1111/j.1547-5069.2005.00011.x
  18. Thomas, M. D. (2016, July 1). ACA in 2016: 10 changes to the Affordable Care Act. Retrieved from https://www.benefitspro.com/2016/07/01/aca-in-2016-10-changes-to-the-affordable-care-act/?slreturn=20200025153710
  19. Tolbert, J., Orgera, K., Singer, N., & Damico, A. (2019, December 13). Key Facts about the Uninsured Population. Retrieved from https://www.kff.org/uninsured/issue-brief/key-facts-about-the-uninsured-population/
  20. U.S. Census Bureau. (2016, December). State Migration Rates, Net Totals: 2011-2016. Retrieved from https://www.governing.com/gov-data/census/state-migration-rates-annual-net-migration-by-state.html
  21. Weinick, R. M., Burns, R. M., & Mehrotra, A. (2010). Many emergency department visits could be managed at urgent care centers and retail clinics. Health affairs (Project Hope)29(9), 1630–1636. https://doi.org/10.1377/hlthaff.2009.0748
  22. Yale University. (n.d.). Linear Regression. Retrieved from http://www.stat.yale.edu/Courses/1997-98/101/linreg.htm
  23. Yanuck, J., Hicks, B., Anderson, C., Billimek, J., Lotfipour, S., & Chakravarthy, B. (2017). The  Affordable Care Act: Disparities in emergency department use for mental health diagnoses in young adults. World journal of emergency medicine8(3), 206–213. https://doi.org/10.5847/wjem.j.1920-8642.2017.03.008.