
Liu J, Subramanian S, Geller A. Identification of “hot spots” of COVID-19 in the United States (January 2020-January 2021). Harvard Public Health Review. 2021; 27.
DOI:10.54111/0001/aa2
To examine the sociodemographic factors associated with US metropolitan or micropolitan statistical areas (MSAs) most impacted by the COVID-19 pandemic and how the sociodemographic profiles of these highest-risk MSAs have changed across two timepoints during the pandemic.
This study compares data on the Top 20 MSAs with the highest cumulative COVID-19 case rate at two timepoints (October 13, 2020 and January 1, 2021). The means of CDC’s Social Vulnerability Index (SVI) variables for the highest risk MSAs were compared with the Welch Two Sample t-test to the means of the SVI variables for the rest of the U.S.
The Top 20 MSAs on October 13, 2020 (Time 1) tended to be located around the US-Mexico border and the South, and the Top 20 MSAs on January 1, 2021 (Time 2) tended to located in the Southwest and Midwest regions. At Time 1, more vulnerable MSAs were disproportionately affected.
Our findings highlight the excessively high rates of COVID-19 and how it is important for clinicians and public health practitioners to consider these “hot spots” when planning interventions.
Social vulnerability, such as poverty, minority status, disability, and other community factors, is associated with an increased risk for adverse health outcomes such as COVID-19 (Dasgupta et al., 2020). In understanding the spread of disease, it has historically been important to look at “hot spots,” or areas that are disproportionately at-risk of an outcome such as higher rates of disease or death (Jenkins, Tuthill, Tannenbaum, & Kirby, 1977). The COVID-19 pandemic has disproportionately affected certain communities and geographies in the US (Chen & Krieger, 2021). We examined the demographic, social correlates of health, and poverty-related factors associated with US metropolitan or micropolitan statistical areas (MSAs) most ravaged by the COVID-19 pandemic and explored how the sociodemographic profiles of these highest-risk MSAs have changed across two timepoints. All comparisons were made with US Census data from 2019.
Beginning on January 21, 2020, the New York Times (NY Times) began gathering case counts of COVID-19 and reported the daily Top 20 MSAs of population greater than 50,000 ranked by the highest cumulative case rate per 1,000 people (NY Times, n.d.-b). MSAs are defined as the core area containing a substantial population along with surrounding communities having a high degree of economic and social integration with that core (United States Census Bureau, n.d.). The NY Times obtained the cumulative counts of COVID-19 cases in the U.S. by compiling time series data from state and local governments and health departments and made this data publicly available through Github (NY Times, n.d.-a).
MSA-level social vulnerability data were obtained from the 2018 CDC Social Vulnerability Index (SVI), developed to identify variables to describe communities with the greatest needs during public health events (Centers for Disease Control and Prevention/ Agency for Toxic Substances and Disease Registry, 2018). The SVI is generated using 15 population-based measures from the US Census (Centers for Disease Control and Prevention/ Agency for Toxic Substances and Disease Registry, 2018).
We examined the highest risk MSAs based on the following MSA groupings – 1) Top 20 MSAs (1/21/20 to 10/13/20) (Time 1); 2) Top 20 MSAs (1/21/20-1/1/21) (Time 2); 3) All MSAs from both timepoints; 4) MSAs appearing at both timepoints; and 5) New MSAs at Time 2 compared with Time 1 (NY Times, n.d.-b). Using R software to conduct our analyses, we calculated means and ranges for the 15 SVI variables, within the five groupings of MSAs, from the US Census’s 2019 5-year American Community Survey (ACS). Means for each SVI variable were also calculated for the MSAs in the entire U.S. with populations greater than 50,000 according to the 2019 5-year ACS. The means of the SVI variables for each grouping of MSAs were compared with the Welch Two Sample t-test to the means of the SVI variables for all US MSAs with population greater than 50,000. The purpose of these comparisons was to explore the SVI variables for the groupings of MSAs most affected by COVID-19 at different timepoints and whether these groupings of MSAs differed significantly from the rest of the US.
On October 13, 2020 (Time 1), cumulative Top 20 COVID-19 rates ranged from a high of 48.9 to 66.5 cases per 1,000. On January 1, 2021 (Time 2), cumulative Top 20 COVID-19 rates rose to a range of 108.6 to 142.9 cases per 1,000. At Time 2, the Top 20 MSAs with the highest number of cumulative COVID-19 cases in the US had 7 of the same MSAs and 13 new MSAs compared with the Top 20 MSAs at Time 1.
Figure 1 highlights the names, locations, and rates per 1,000 of these Top 20 MSAs on a U.S. map at Time 1 and Time 2, and which MSAs stayed the same at both timepoints. Overall, the MSAs at both timepoints are largely located in the Midwest, Southeast, and Southwest. The MSAs at Time 1 tended to be located around the US-Mexico border and the South, and MSAs at Time 2 tended to be located in the Southwest and Midwest regions.
In comparing the SVI variables, MSAs from Time 1 (Figure 1) had higher rates of poverty, greater unemployment, lower median household income, less education, more older adults age 65 and older, more youth age 17 or younger, more minority individuals, lower English- speaking level, and higher rates of crowding, compared with MSAs in the entire U.S. with populations greater than 50,000 (rest of US) (Tables 1 and 2). MSAs from Time 2 (Figure 1) had more older adults age 65 and older, more youth age 17 or younger, more disabled individuals, and more single-parent households compared with the rest of US (Table 1). Overall, compared with Time 1 MSAs, Time 2 MSAs had fewer social vulnerabilities but differed markedly from the rest of the US (Table 2).
At Time 1 and Time 2, 33 unique MSAs collectively had the highest US rates at both timepoints (Figure 1). The 33 MSAs had lower median household income, less education, more older adults age 65 and older, more youth age 17 or younger, and more single-parent households, more minority individuals, lower English-speaking level, and higher rates of crowding, compared with the rest of the US (Tables 1 and 2).
Seven MSAs were at highest risk in both timepoints (Figure 1) and they had more older adults age 65 and older, more youth age 17 or younger, and more minority individuals, compared with the rest of the US (See Tables 1 and 2). At Time 2, 13 new MSAs emerged (Figure 1), and they had higher unemployment, more older adults age 65 and older, more youth age 17 or younger, more disabled individuals, more multi-unit structures, and more mobile homes, compared with the rest of the US (Tables 1 and 2).
We have identified our nation’s COVID-19 highest-risk MSAs or so-called “hot spots.” Six months into the pandemic (March-October 2020), more vulnerable MSAs were disproportionately affected. Three months later, even as the epicenter of the pandemic shifted, the majority of the highest-risk MSAs differed substantially from the rest of the US across many of the SVI variables. Our findings underscore a central tenet of this pandemic in which a constellation of factors such as minority status, older age, poverty, and geography work to catalyze the evolution of highest-risk areas. Herein, a high of at least 1 per 7 individuals in these highest-risk MSAs have been diagnosed with COVID-19-likely profound underestimates as a significant proportion of residents in these communities have not been routinely tested (Fouad, Ruffin, & Vickers, 2020; Louis-Jean, Cenat, Njoku, Angelo, & Sanon, 2020).
A limitation of this analysis is that we only had access to the Top 20 MSAs at both time points. We also lack mortality data on each of these communities as this data is not available at the level of the MSA. There may also be limitations to looking at COVID-19 cases at the MSA-level; however, our findings support previous analyses done at the county-level on COVID-19 disparities (Dasgupta et al., 2020; Moore et al., 2020; Strully, Yang, & Liu, 2021). The MSA-level analysis provides a more granular approach compared to the county-level to understanding COVID-19 disparities, while also capturing data on incorporated cities and towns that would not have been included at the city-level (United States Census Bureau, n.d.).
Our findings locate US MSAs with the highest cumulative rates of COVID-19 and describe the wealth of socially vulnerable factors that drive and sustain their growth. Identifying so-called “hot spots” have critical importance in the planning of both clinical and population-based interventions, including non-pharmacological interventions, preventive messaging, and vaccination efforts. These highest-risk MSAs are but a window to the other MSAs that have been profoundly affected by COVID but whose incidence rates likely fall close behind.
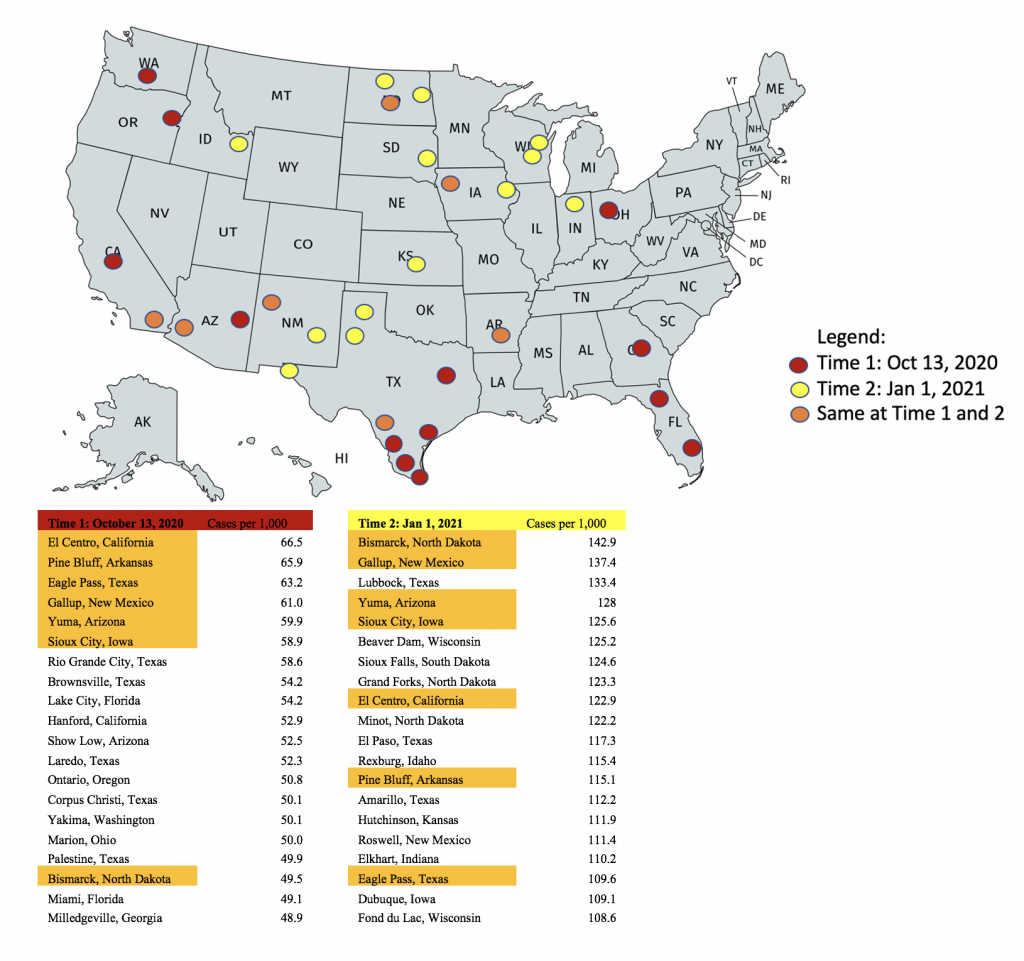
Table 1: Associations of SVI Variables and Highest-Risk MSAs
Oct 2020 | Jan 2021 | 33 Cities | Same 7 Cities | 13 New Cities | US > 50K | |||||||||||
Mean | Range | p | Mean | Range | p | Mean | Range | p | Mean | Range | p | Mean | Range | p | Mean | |
Below Poverty (%) | 20.1 | 26.9 | 0.003 | 16.6 | 26.9 | 0.51 | 18.3 | 26.9 | 0.037 | 21.0 | 26.9 | 0.151 | 14.2 | 18.2 | 0.44 | 15.5 |
Unemployed (%) | 7.9 | 12.5 | 0.015 | 5.8 | 12.1 | 0.865 | 6.4 | 12.5 | 0.226 | 8.8 | 12.1 | 0.121 | 4.2 | 3.8 | <0.001 | 5.7 |
Median household income ($) | 47169 | 41011 | 0.001 | 53181 | 37564 | 0.317 | 50532 | 41011 | 0.008 | 48494 | 37564 | 0.197 | 55705 | 25310 | 0.971 | 55619 |
No High School Diploma (%) | 22.3 | 40.3 | <0.001 | 15.5 | 34.5 | 0.113 | 18.2 | 40.7 | 0.001 | 22.1 | 34.1 | 0.059 | 11.9 | 15.8 | 0.973 | 11.9 |
Aged 65+ (%) | 14.6 | 9.3 | 0.001 | 14.6 | 10.1 | <0.001 | 14.6 | 10.1 | <0.001 | 14.6 | 7.0 | 0.043 | 14.5 | 10.1 | 0.005 | 17.2 |
Age 17 or Younger (%) | 25.9 | 15.1 | 0.002 | 25.1 | 10.8 | <0.001 | 25.3 | 15.1 | <0.001 | 26.4 | 10.4 | 0.021 | 24.5 | 7.0 | 0.005 | 22.1 |
Older than Age 5 with Disability (%) | 14.6 | 9.8 | 0.97 | 12.8 | 8.6 | 0.004 | 13.7 | 13.7 | 0.066 | 13.9 | 8.6 | 0.53 | 12.3 | 6.5 | 0.001 | 14.6 |
Single-Parent Households (%) | 4.9 | 2.9 | 0.151 | 4.7 | 3.9 | 0.047 | 4.8 | 3.9 | 0.04 | 4.7 | 2.0 | 0.172 | 4.7 | 3.9 | 0.152 | 5.2 |
Minority (all persons except white, non-Hispanic) (%) | 60.6 | 88.5 | <0.001 | 40.3 | 88.3 | 0.091 | 47.8 | 90.1 | 0.001 | 62.8 | 86.0 | 0.032 | 28.1 | 78.7 | 0.929 | 27.5 |
Speaks English “Less than Well” (%) | 9.1 | 27.1 | 0.008 | 5.2 | 24.5 | 0.227 | 6.6 | 27.1 | 0.02 | 9.7 | 24.5 | 0.138 | 2.8 | 13.9 | 0.762 | 3.1 |
Multi-Unit Structures (%) | 7.6 | 32.9 | 0.792 | 10.6 | 5.6 | 0.083 | 9.6 | 32.9 | 0.238 | 7.0 | 14.7 | 0.588 | 12.6 | 22.0 | 0.025 | 8.0 |
Mobile Homes(%) | 14 | 35.1 | 0.052 | 9 | 26.4 | 0.739 | 10.9 | 35.1 | 0.393 | 14.6 | 25.4 | 0.194 | 6.0 | 9.7 | <0.001 | 9.5 |
Crowding (%) | 6.7 | 13 | <0.001 | 4.5 | 13.0 | 0.051 | 5.2 | 13.0 | 0.001 | 7.2 | 12.7 | 0.058 | 3.0 | 7.1 | 0.554 | 2.6 |
No Vehicle (%) | 6.9 | 4.7 | 0.493 | 6.2 | 3.8 | 0.417 | 6.6 | 5.3 | 0.974 | 6.6 | 2.0 | 0.954 | 6.0 | 3.8 | 0.36 | 6.6 |
Group Quarters (%) | 5.3 | 22.9 | 0.159 | 3.6 | 12.1 | 0.773 | 4.6 | 22.9 | 0.164 | 3.9 | 12.1 | 0.769 | 3.4 | 3.9 | 0.996 | 3.4 |
*Notes: p-values compare each grouping of MSAs to all MSAs in the US with a population greater than 50,000 with a two-sample t-test, significant values are bolded.
Table 2: How SVI Variables Differed Significantly from the rest of the U.S. across Groupings of MSAs
Time 1 | Time 2 | All 33 Cities | Same 7 Cities | 13 New Cities | |
Below Poverty (%) | x | x | |||
Unemployed (%) | x | x | |||
Median household income ($) | x | x | |||
No High School Diploma (%) | x | x | |||
Aged 65+ (%) | x | x | x | x | x |
Age 17 or Younger (%) | x | x | x | x | x |
Older than Age 5 with Disability (%) | x | x | |||
Single-Parent Households (%) | x | x | |||
Minority (all persons except white, non-Hispanic) (%) | x | x | x | ||
Speaks English “Less than Well” (%) | x | x | |||
Multi-Unit Structures (%) | x | ||||
Mobile Homes(%) | x | ||||
Crowding (%) | x | x | |||
No Vehicle (%) | |||||
Group Quarters (%) |
*Note: “x” denotes that SVI variable significantly differed from the rest of the U.S. based on a two-sample t-test.
[1] Centers for Disease Control and Prevention/ Agency for Toxic Substances and Disease Registry. (2018). CDC Social Vulnerability Index 2018 Database US. Retrieved February 1, 2021, from https://www.atsdr.cdc.gov/placeandhealth/svi/data_documentation_download.html.
[2] Chen, J. T., & Krieger, N. (2021). Revealing the Unequal Burden of COVID-19 by Income, Race/Ethnicity, and Household Crowding: US County Versus Zip Code Analyses. Journal of Public Health Management and Practice, 27(1), S43–S56. https://doi.org/10.1097/PHH.0000000000001263
[3] Dasgupta, S., Bowen, V. B., Leidner, A., Fletcher, K., Musial, T., & Rose, C. (2020). Association Between Social Vulnerability and a County’s Risk for Becoming a COVID-19 Hotspot. Morbidity and Mortality Weekly Report, 69(42), 1535–1541.
[4] Fouad, M. N., Ruffin, J., & Vickers, S. M. (2020, October 1). COVID-19 Is Disproportionately High in African Americans. This Will Come as No Surprise…. American Journal of Medicine, Vol. 133, pp. e544–e545. https://doi.org/10.1016/j.amjmed.2020.04.008
[5] Jenkins, C. D., Tuthill, R. W., Tannenbaum, S. I., & Kirby, C. R. (1977). Zones of Excess Mortality in Massachusetts. New England Journal of Medicine, 296(23), 1354–1356. https://doi.org/10.1056/nejm197706092962315
[6] Louis-Jean, J., Cenat, K., Njoku, C. V., Angelo, J., & Sanon, D. (2020). Coronavirus (COVID-19) and Racial Disparities: a Perspective Analysis. Journal of Racial and Ethnic Health Disparities, 7(6), 1039–1045. https://doi.org/10.1007/s40615-020-00879-4
[7] Moore, J. T., Ricaldi, J. N., Rose, C. E., Fuld, J., Parise, M., Kang, G. J., … Westergaard, R. (2020). Disparities in Incidence of COVID-19 Among Underrepresented Racial/Ethnic Groups in Counties Identified as Hotspots During June 5–18, 2020 — 22 States, February–June 2020. MMWR. Morbidity and Mortality Weekly Report, 69(33), 1122–1126. https://doi.org/10.15585/mmwr.mm6933e1
[8] NY Times. (n.d.-a). GitHub – nytimes/covid-19-data: An ongoing repository of data on coronavirus cases and deaths in the U.S. Retrieved February 1, 2021, from https://github.com/nytimes/covid-19-data
[9] NY Times. (n.d.-b). Monitoring the Coronavirus Outbreak in Metro Areas Across the U.S. – The New York Times. Retrieved February 1, 2021, from https://www.nytimes.com/interactive/2020/04/23/upshot/five-ways-to-monitor-coronavirus-outbreak-us.html#hotspots
[10] Strully, K., Yang, T. C., & Liu, H. (2021). Regional variation in COVID-19 disparities: connections with immigrant and Latinx communities in U.S. counties. Annals of Epidemiology, 53, 56-62.e2. https://doi.org/10.1016/j.annepidem.2020.08.016
[11] United States Census Bureau. (n.d.). About Metropolitan and Micropolitan. Retrieved February 3, 2021, from https://www.census.gov/programs-surveys/metro-micro/about.html
Jessica Liu is a 2nd year Population Health Sciences doctoral student in the Department of Social and Behavioral Sciences. Prior to her studies at Harvard School of Public Health, Jessica completed her Master’s in Public Health at Yale School of Public Health, where she focused her research interests on substance use in adolescents and prevention education. Through her doctoral studies, Jessica hopes to continue her focus on tobacco research and expand more on marijuana products and social media messaging.
S (“Subu”) V Subramanian is a Professor of Population Health and Geography at Harvard University, and chair of the Faculty Advisory Group for the Center for Geographic Analysis at Harvard University. He is a Primary Faculty in the Department of Social and Behavioral Sciences at the Harvard T.H. Chan School of Public Health, a Core Faculty of the Harvard Center for Population and Development Studies, and a Faculty Affiliate of the Harvard Department of Sociology. He is also an Honorary Senior Fellow of the National Institution for Transforming India (NITI) Aayog, Government of India and the PI of the Geographic Insights Lab. Subramanian was the Founding Director of Graduate Studies for the interdisciplinary PhD program in Population Health Sciences at Harvard. He received his under- and post-graduate training at the University of Delhi, and completed his PhD in geography at the University of Portsmouth. He has published over 700 articles, book chapters, and books in the broad field of population health and well-being and in applied multilevel statistical methods. His current research interests include developing and applying data science approaches for precision public policy in the context of health, nutrition and development; and understanding individual and population heterogeneity in health and well-being from a multilevel and cross-comparative perspective. He has consistently been included in the Highly Cited Researchers list since 2015 (top 1% of cited publications in Web of Science). As an educator, Subramanian was the first to develop a course on the concept and application of multilevel statistical methods at Harvard, which he has been successfully teaching at Harvard since 2001, as well as around the world. He has advised over 150 masters, doctoral, and postdoctoral students as a mentor, academic advisor and dissertation committee member. Subramanian is the Co-Editor-in-Chief of the international journal Social Science & Medicine, a Co-Senior Editor of the social epidemiology office of Social Science & Medicine, and the founding Co-Editor-in-Chief of SSM – Population Health, winner of the 2020 PROSE Award for Best New Journal in Social Sciences. He is an editorial consultant to The Lancet, and an international advisory board member for The Lancet Global Health.
I have been a Harvard T.H. Chan School of Public Health, Social and Behavioral Science (SBS) faculty member since 2010. I took a very circuitous path to a public health career. I moved to Boston in 1973 and worked for years as a day care worker, steelworker, and then obtained my nursing degree in 1984. I worked on a surgical oncology floor and through caring for many patients with preventable but late-stage cancers, I began to see first hand the strong and compelling need for cancer screening and prevention research.
My current projects are varied and challenging with strong interests in cancer disparities, cancer screening, and community-based and home/family interventions. My primary research is aimed at reducing the disproportionate burden of melanoma mortality for persons of lower SES and middle-aged and older men. We have tried to accomplish this through public awareness, national and international screening programs, training, and exploring patient and physician communication patterns. We also have a number of Federal grants for tobacco cessation and elimination of second-hand smoke exposure in multiple venues, including public housing developments. I am very excited about participating in a randomized trial for smoking cessation that was recently conducted at Children’s Hospital to reach parents of hospitalized children. I am also the PI for a new NIH RO1 entitled Reducing Risks of Skin Cancer among Childhood Cancer Survivors. For the past three years, I have taught a class entitled ‘Successes and Challenges in Health Behavior Change’ where we look at some of the more successful comprehensive public health initiatives such as tobacco campaigns to see what lessons we can learn for modern-day epidemics such as those for tanning beds and obesity.
HPHR.org was designed by ComputerAlly.com.
Visit HPHR’s publisher, the Boston Congress of Public Health (BCPH).
Email communications@bcph.org for more information.
Click below to make a tax-deductible donation supporting the educational initiatives of the Boston Congress of Public Health, publisher of HPHR Journal.![]()