
Amin S, Peddu D, Majmudar G, Weber P. The effect of state mandate timing on COVID-19 incidence rates. HPHR. 2021; 27.
DOI:10.54111/0001/aa9
The COVID-19 pandemic has disrupted the global medical system and in the absence of efficacious pharmaceutical interventions, nations, including the United States, have turned to non-pharmaceutical interventions (NPIs) such as public masking and regulation of non-essential public spaces. The application of these NPIs have varied between countries in terms of timing and stringency.1
In the United States, the power to influence these interventions has been left in the hands of individual states. As a result, state officials have been placed under great scrutiny regarding public health mandates with the potential to dramatically change daily case rates. Some states have favored a passive public health approach, meaning slower implementation of NPIs in the form of later masking mandates and earlier openings of public venues. Alternatively, some states have favored an active public health approach, meaning earlier implementation of NPIs in the form of earlier mask mandates and later openings of public venues. The difference in approach between these groups of states has fueled debate on what is the most effective public health strategy.2
Current literature on the topic of COVID-19 based state mandates have focused on individual public health mandates specifically public masking mandates. Mathematical modeling has highlighted that timely and comprehensive NPIs such as public masking are needed to reduce the virus transmission rate to prevent a secondary wave.3 Furthermore, exploration of changes in the daily county-level COVID-19 growth rates during a two-month period from March to May 2020 revealed that mandating face mask use in public is associated with a decline in the daily COVID-19 growth rate.4
Although studies have been conducted on the efficacy of solitary public health mandates, minimal research exists exploring the potential interplay of these mandates when it comes to reopening of public spaces.4 In this study, we explore the effect of timing of government mandates on COVID-19 incidence rates, specifically highlighting two of the more controversial state mandates: mandatory mask usage and bar openings. Our exploration is centered on two states with active public health approaches — New York and New Jersey — and two states with passive public health approaches — Florida and Texas.2 Our intention through this study is to demonstrate the efficacy in sequential active public health planning in response to a pandemic.
Table 1: Mask Mandate Implementation and Bar Opening Dates
| State | Mask Mandate | Bar opening |
|---|---|---|
| New York | 4/17/20 | 6/22/20 |
| New Jersry | 4/8/20 | 6/15/20 |
| Texas | 7/2/20* | 5/22/2020 |
| Florida | N/A | 6/5/2020 |
*Mask mandate was implemented after study interval
For the two states with mask mandates, control difference of means testing was performed over the 20 days before each of the mandates in order to determine if there were significant fluctuations in incidence prior (Table 2). In New York, mask mandates went into effect on April17, 2020. Therefore, COVID-19 incidence was compared in two 10-day intervals from 3/28/20-4/06/20, and 4/07/20-4/16/20.8 In New Jersey, mask mandates went into effect on April 8, 2020. Similarly, COVID-19 incidence was compared in two 10-day intervals from 3/19/20- 3/28/20, and 3/29/20-4/07/20. 7 The shorter 10-day intervals were used to capture the rapidly emergingdata variability attributable to circumstances related to the pandemic during March and April.
After establishing control, incidence rates for 21 days before and after mask mandates in New York and New Jersey were calculated (Table 2). When accounting for incidence after mask mandates, 21 days were measured 5 days after the mask mandate date, to account for the median COVID-19 incubation period.10 The longer 21-day intervals were used to capture the greater data homogeneity and availability due to circumstances related to the pandemic in May and June. Difference in means testing was performed to determine whether changes in incidence were significant.
A similar control protocol was applied to the analysis of opening of bars in each respective state, as control difference of means testing was performed over the 20 days before each bar opening in order to determine if there were significant fluctuations in incidence prior (Table 3). In New York, due to bars opening on June 22, 2020, COVID-19 incidence was compared in two 10-day intervals from 6/02/20- 6/11/20, and 6/12/20-6/21/20.8 In New Jersey, since bars opened on June 15, 2020, COVID-19 incidence was compared in two 10-day intervals from 5/26/20-6/04/20, and 6/05/20-6/14/20.7 In Florida, as bars opened on June 5, 2020, COVID-19 incidence was compared in two 10-day intervals from 5/16/20- 5/25/20, and 5/26/20- 6/04/20. 6 In Texas, due to bars opening on May 22, 2020, COVID-19 incidence was compared in two 10-day intervals from 5/2/20- 5/11/20, and 5/12/20- 5/21/20.9
After establishing control, COVID-19 incidence rates, 21 days before and after bars opening in all four states, were calculated (Table 3). As done previously, when accounting for incidence after bars opening, 21 days were measured 5 days after bar venues opened, to account for the median COVID-19 incubation period.10 Difference in means testing was performed to determine whether changes in incidence were significant.
Table 2: Difference in COVID-19 Incidence Regarding Mask Mandate Implementation
| COVID-19 Incidence Control | Mask Mandate Implementation | Incidence Rate (per 100,000) | ||||
|---|---|---|---|---|---|---|
| T value | P value* | T Value | P value* | Before Mask Mandate | After Mask Mandate | |
| New York | 0.613 | 0.273 | 8.005 | <0.001 | 952.898 | 497.007 |
| New Jersey | -6.410 | <0.001 | -2.938 | 0.003 | 435.295 | 721.426 |
*An alpha value of 0.05 was used to signify significance
TABLE 2: The COVID-19 Incidence Control panel checks for significant fluctuations in incidence before mask mandate implementation. The Mask Mandate Implementation panel reviews statistical difference in COVID-19 incidence in two active public health approach states before and after mask mandates. The Incidence Rate panel displays the calculated incidence rates before and after mask mandates.
Control for Mask Mandate
When comparing COVID-19 incidence, results showed that New York had no significant changes in daily incidence in the previous 20 days before mask mandates were implemented. New Jersey, on the other hand, had a significant difference (p<0.001) in incidence rate, with T values showing a rise in incidence in the latter 10 days of measurement. As New Jersey was the first state to implement mask mandates, on April 8 during a peak COVID-19 outbreak, this rise is accounted for.7
T test for COVID-19 incidence prior and post mask mandate
Incidence rates for New York and New Jersey differed before and after mask mandate implementation. After difference of means testing for significance, results showed that New York had a significant decrease in COVID-19 incidence for 21 days after mask mandate implementation (p<0.001). However, New Jersey had a continuously significant rise in cases, mirroring the trend seen prior to mask mandate implementation. As New Jersey implemented mask mandates earlier than any other state, this trend was eventually reversed as time went on (see Table 3).
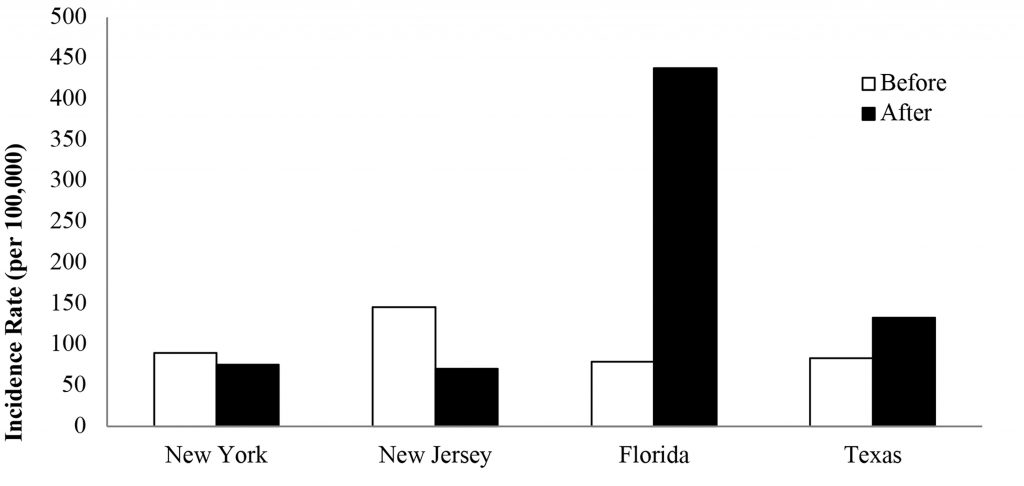
Table 3: Difference in COVID-19 Incidence Regarding Bar Openings
| COVID-19 Incidence Control | Bar Opening | Incidence Rate (per 100,000) | ||||
|---|---|---|---|---|---|---|
| T value | P value* | T Value | P value* | Before Bar Opening | After Bar Opening | |
| New York | 2.654 | 0.008 | 2.496 | 0.008 | 89.953 | 75.448 |
| New Jersey | 3.322 | 0.002 | 5.205 | <0.001 | 145.749 | 70.290 |
| Florida | -0.064 | 0.475 | -6.149 | <0.001 | 79.185 | 437.951 |
| Texas | 1.646 | 0.059 | -3.404 | <0.001 | 83.753 | 132.746 |
*An alpha value of 0.05 was used to signify significance
TABLE 3: The COVID-19 Incidence Control panel checks for significant fluctuations in incidence before bar opening. The Bar Opening panel reviews differences in COVID-19 incidence rates in four states, two active public health approach states (NY and NJ) and two passive public health approach states (FL and TX), before and after bar openings. The Incidence Rate panel displays the calculated incidence rates before and after bar openings.
Figure 1: Incidence Rate Before and After Bar Openings
Control for Bar Openings
Results showed that for 20 days prior to bars opening, the two states with mask mandates had significant decreases in COVID-19 incidence. However, the two states without a mask mandate had no significant rise or fall in COVID-19 incidence for 20 days prior to bars opening.
T test for COVID-19 incidence prior and post bars opening
Incidence rates for the four states differed before and after bar opening (Figure 1). After difference of means testing for significance, we found that the two states with mask mandates prior to bars opening, New York and New Jersey, had sustained lower COVID-19 incidence for 21 days after opening bars to the public (NY p=0.008, NJ p<0.001). However, the two states that opened bars without prior mask mandates, Florida and Texas, had significantly higher COVID 19 incidence for 21 days after opening bars to the public (FL p<0.001, TX p<0.001). This increase is despite having stagnant incidence prior to bars opening.
Our results showed that active public health approach states, New York and New Jersey, continued their previous trend of reducing COVID-19 incidence rates even after public reopening of bars. To contrast, the passive public health approach states, Florida and Texas, had increasing incidence rates after public reopening of bars. These results suggest that NPIs such as mask mandates may play a factor in safer re-openings of public venues during the COVID-19 pandemic.
While the solitary implementation of mask mandates is important, our study emphasizes the need for government officials to pay specific attention to the timing and ordering of their mandates, where mask mandates prior to bar opening could potentially play a significant role in attenuating COVID-19 incidence rates. As demonstrated in both New York and New Jersey, it is possible to continue the declines in incidence rate even with public venue reopening, if a mask mandate is implemented beforehand. On the other hand, analysis of data in Texas and Florida highlights the potential rise in incidence with public venue reopening, if mask mandates are not incorporated into public health policy measures in a timely fashion.
Furthermore, it may be valuable to examine rates of incidence prior to public re-openings of venues. Even in the two states with mandates, venues were not reopened until incidence was on the decline, whereas the states with a passive public health approach reopened venues without a downward trend in incidence rate. Therefore, even without a mask mandate, waiting to reopen bars could have proved less detrimental in rise in incidence in these states.
Finally, the timing of the COVID-19 pandemic affected the methodology of data analysis in this study. Early on in the pandemic, incidence rates were highly variable and underreported, necessitating data capture beginning in late March to provide more accuracy in difference of means analysis. Therefore, in testing controls for bars and masks, two shorter 10-day intervalswere used to compare COVID-19 incidence. By late May and June, COVID-19 testing became more implemented and daily incidence data was more readily available. Therefore, in testing for differences in incidence with regards to public health policy implementation, longer 21-day intervals were employed before and after NPIs.
Our study underscores the importance of sequence and timing in public health planning. This alludes to the potential advantageous effect of state mandates with regards to reducing disease incidence when reopening public spaces. Future work should include analysis of an expanded list of states and state mandates, longer time frame, analysis by county, and an exploration of other confounding factors (i.e. availability of testing, adherence). We recognize that our study provides an analysis of a short time period and as such, further validation studies are needed to determine long term effects.
HPHR.org was designed by ComputerAlly.com.
Visit HPHR’s publisher, the Boston Congress of Public Health (BCPH).
Email communications@bcph.org for more information.
Click below to make a tax-deductible donation supporting the educational initiatives of the Boston Congress of Public Health, publisher of HPHR Journal.![]()