
Haque L. The effect of delays in acute medical treatment on total cost and potential ramifications due to the coronavirus pandemic. Harvard Public Health Review. 2021; 26.
DOI:10.54111/0001/Z7
With the rise of novel coronavirus cases, hospitals across the United States have become inundated with patients. Due to a severe lack of resources including healthcare workers, personal protective equipment, beds, and ventilators, patients are faced with significant delays for medical treatment. By utilizing California Public Patient Discharge data to examine 1,750,850 patients, this study explores the effect of medical treatment delays on total cost. ‘Delay’ is defined as the number of days between a patient’s initial diagnosis or hospital admission until treatment. ‘Total Cost’ includes the total monetary charge for services rendered during the length of stay at the hospital facility. An OLS regression model with diagnosis fixed effects, hospital fixed effects, and patient-specific controls was used. When running a regression of log Total Cost on Delay, it was found that, on average and ceteris paribus, an additional day of delay resulted in a 10.6 log point (11.2%) increase in total cost. Results were found to be statistically significant (p<0.01). When compared with Day 0 (no delay), a delay of one day increased total cost by 14.1% ($40,619.3USD), 30.5% the second day ($46,443.9USD), 46.5% the third day ($52,156.3USD), 62.9% the fourth day ($57,988.5USD), and 78.4% the fifth day ($63,513.0USD). If we compare a delay of six days to no delay, we find an increased total cost of 95% ($69,424.8), approximately double the cost of treatment of Day 0 ($35,596.4USD). Consequent to our observed correlation between Delay and Total Cost, the magnitude of increased Total Cost could potentially be debilitating for patients and families.
In the United States, hospitals are facing an unprecedented scarcity of resources (American Hospital Association, 2020) amid tens of thousands of coronavirus deaths and with thousands more patients infected and needing care (CDC, 2020). With the demand for care significantly outweighing the supply of resources such as hospital staff, beds, and equipment, patients are facing severe delays for acute medical treatment (Grady, 2020). The effect of treatment delays may have significant ramifications to total costs. With a potential recession on the horizon (Pickert et al., 2019), government spending and patient livelihood may be severely impacted. It might end up costing policy makers, hospital administrators, and families more to help delayed patients later. Hence, it is critical to determine if there is a relationship between treatment delay and total cost.
Despite economic and social implications, there is a lack of scholarly literature that explores the effect of treatment delays on total cost beyond the scope of patient demographic factors (Tsai et al., 2014; Kraft et al., 2009; O’Leary et al., 2014) and specific procedures (Yardeni et al., 2004; Schwartz et al., 2015; Qadar et al., 2014). This study will investigate the effect of treatment delays without demographic considerations and on a wider set of patient diagnoses, which may aid with resource allocation and fiscal planning to meet current healthcare needs. We will establish to what extent, if any, an increase in treatment delay will have on total costs and if a relationship between treatment delay and total cost exists, the main objective is to calculate by how much the total cost varies when compared to no treatment delay.
2014 California Public Patient Discharge Data was analyzed to examine Total Cost against treatment Delay among patients admitted to acute care hospitals in California. The data set included information from 451 hospitals across the state and 3,794,259 patients. Due to HIPAA-limited dataset status, identifiable demographic variables such as patient age, race, and gender were redacted from the dataset and hence, the effect of such demographic variables were not included in this study. To keep the sample of patients homogeneous, newborn patients were excluded. After cleaning the data, 1,750,850 viable data points were evaluated.
The variable ‘Delay’ was defined as the number of days between a patient’s initial diagnosis or hospital admission until treatment. ‘Delay’ was limited to the 99th percentile to avoid the influence of outliers and was evaluated between the values of 0 to 12 days of delay. ‘Total Cost’ ($USD) includes the total monetary charge for services rendered during the length of stay at the hospital facility and is not restricted to treatment costs that pertain solely to the patient’s original diagnosis. We log transformed Total Cost since data were highly skewed (Total Cost and Delay), with the assumption that the standard errors associated with Total Cost were normally distributed. Table A1 shows that the 95th percentile of patients were within 4 days of delay and includes summary statistics for ‘Delay’, ‘Total Cost’ and all other control variables.
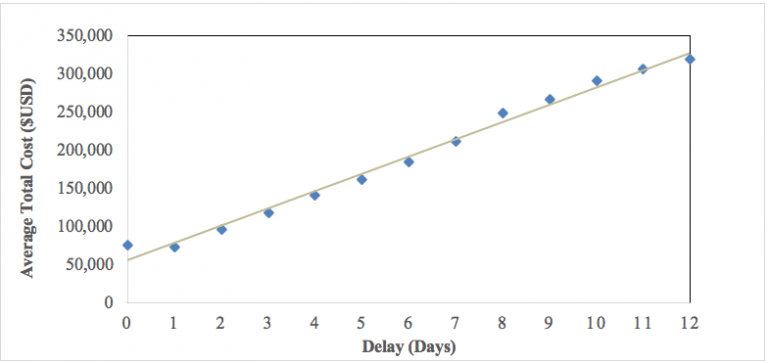
Figure 1 depicts the Average Total Cost ($USD) of treatment per day of Delay. Figure 1 did not consider any control variables and shows a linear relationship between Delay and Average Total Cost.
This study initially regressed log Total Cost against Delay to determine whether a correlation between treatment delay and total cost existed. The primary ordinary least squares regression equation is as follows in equation (1):
In equation (1), i indexes the individual, Total Costi represents the outcome variable for the total cost accumulated by the individual patient i, and is transformed to a log scale. Delayi signifies the number of days delayed (0-12 days) for patient i to receive treatment, and εi stands for the error term.
Due to the variation in delay between patients with different diagnoses, the regression included diagnosis fixed effects. By including diagnosis fixed effects, we considered how different diagnoses might require faster treatment. For example, using the summary statistics of diagnosis categories in Table A2, infectious and parasitic diseases might not require as timely treatment as diseases of the circulatory system, due to the greater complexity of circulatory system diagnoses. Equation (2) included diagnosis fixed effects, where αd is the vector for diagnosis fixed effects. We used clustered standard errors for diagnoses and assumed that the covariance between different diagnosis groups was non-zero.
In addition to diagnosis fixed effects, equation (2) also included a vector for hospital fixed effects (µh) for patient i, to account for differences between hospitals in California, that are constant over time. Some hospitals may be more efficient at triage and time management due to more staff on hand or catering to a smaller population of patients. Hence, by adding hospital fixed effects, we mitigated the effect of such variation.
Equation (3) determined if the coefficient on β1 was over or underestimated by adding controls. Delay is not random but by adding covariates, the non-random nature of delay was moderated. Xidh is a vector of control variables that included individual patient characteristics such as payment category, admission type, admission source, patient residence type, and severity code, all of which are dummy variables. As a vector, Xidh represented all the categories contained within the specified patient characteristic variables (for example, ‘admission type’ includes scheduled and unscheduled patients, ‘residential type’ includes local, foreign, and homeless). A full list of all control variables and subcategories can be found in Table A1. To avoid collinearity, each control variable had a category omitted for comparison when running the regression. Each control variable was added sequentially until all controls had been added to equation (3). Once all controls had been added, we then ran equation (3) with the highest number of controls again, but set Delay (which lies between 0-12 days) as a dummy variable itself, to determine the effect of an additional day of delay when compared to no delay.
| (1) | (2) | (3) | (4) | (5) | (6) | (7) | (8) | |
| ln(Total Cost) | ln(Total Cost) | ln(Total Cost) | ln(Total Cost) | ln(Total Cost) | ln(Total Cost) | ln(Total Cost) | ln(Total Cost) | |
| DELAY | 0.137*** | 0.111*** | 0.107*** | 0.107*** | 0.106*** | 0.106*** | 0.106*** | 0.106*** |
| (0.0052) | (0.00555) | (0.00521) | (0.00518) | (0.00555) | (0.00556) | (0.00556) | (0.00553) | |
| PAYMENT CATEGORY | ||||||||
| Medi-Cal | 0.0389** | 0.0146 | 0.00827 | 0.00910 | 0.00913 | |||
| (0.0175) | (0.0133) | (0.0137) | (0.0137) | (0.0137) | ||||
| Medicare | 0.0486** | 0.0204 | 0.0127 | 0.0143 | 0.0142 | |||
| (0.0201) | (0.0162) | (0.0164) | (0.0164) | (0.0164) | ||||
| Other Government | 0.0794*** | 0.0159 | 0.0220* | 0.0233* | 0.0231* | |||
| (0.0303) | (0.0127) | (0.0127) | (0.0127) | (0.0127) | ||||
| Other Indigent | 0.0361 | 0.0222 | 0.0171 | 0.0157 | 0.0151 | |||
| (0.0223) | (0.0204) | (0.0207) | (0.0205) | (0.0205) | ||||
| Other Payer | 0.0252 | -0.00300 | -0.00736 | -0.00616 | -0.0060 | |||
| (0.0195) | (0.0141) | (0.0143) | (0.0142) | (0.0142) | ||||
| Private Coverage | 0.0157 | -0.00136 | -0.00759 | -0.00624 | -0.0061 | |||
| (0.0173) | (0.0151) | (0.0154) | (0.0153) | (0.0153) | ||||
| Self Pay | -0.0294** | -0.0374*** | -0.0432*** | -0.0426*** | -0.0425*** | |||
| (0.0146) | (0.0126) | (0.0129) | (0.0128) | (0.0128) | ||||
| Workers Compensation | 0.0828*** | 0.0552*** | 0.0491*** | 0.0509*** | 0.0507*** | |||
| (0.0208) | (0.0170) | (0.0172) | (0.0171) | (0.0171) | ||||
| ADMISSION TYPE | ||||||||
| Unscheduled | 0.00528 | 0.00561 | 0.00547 | 0.0039 | ||||
| (0.0146) | (0.0147) | (0.0147) | (0.0142) | |||||
| ADMISSION SOURCE | ||||||||
| Residential Care Facility | -0.0115* | -0.0112 | -0.0113* | |||||
| (0.00684) | (0.00684) | (0.0068) | ||||||
| Ambulatory Surgery | -0.0380*** | -0.0378*** | -0.0379*** | |||||
| (0.0128) | (0.0129) | (0.0129) | ||||||
| Skilled Nursing/Immediate Care | 0.0423*** | 0.0426*** | 0.0424*** | |||||
| (0.0122) | (0.0123) | (0.0122506) | ||||||
| Acute Inpatient Hospital Care | 0.0670*** | 0.0673*** | 0.0665*** | |||||
| (0.0206) | (0.0206) | (0.0206) | ||||||
| Other Inpatient Hospital Care | 0.0456*** | 0.0458*** | 0.0441*** | |||||
| (0.0150) | (0.0150) | (0.01495) | ||||||
| Prison/Jail | -0.0988*** | -0.0993*** | -0.0988*** | |||||
| (0.0157) | (0.0158) | (0.0158) | ||||||
| Other | -0.0729*** | -0.0724*** | -0.0727*** | |||||
| (0.0158) | (0.0159) | (0.0158) | ||||||
| RESIDENTIAL TYPE | ||||||||
| Foreign | 0.00845 | 0.0086 | ||||||
| (0.0267) | (0.0267) | |||||||
| Homeless | 0.115*** | 0.11543*** | ||||||
| (0.0140) | (0.01398) | |||||||
| SEVERITY CODE | ||||||||
| Presence of MCC | 0.2017*** | |||||||
| (0.0459) | ||||||||
| No presence of CC or MCC | 0.1658* | |||||||
| (0.0968) | ||||||||
| Constant | 9.47*** | 10.55*** | 10.43*** | 10.40*** | 10.62*** | 10.62*** | 10.62*** | 10.48*** |
| (0.085) | (0.00550) | (0.0196) | (0.0243) | (0.0221) | (0.0221) | (0.0222) | (0.0625) | |
| FIXED EFFECTS | ||||||||
| Diagnosis FE | NO | YES | YES | YES | YES | YES | YES | YES |
| Hospital FE | NO | NO | YES | YES | YES | YES | YES | YES |
| N = Observations | 1,750,850 | 1,750,850 | 1,750,850 | 1,750,850 | 1,750,850 | 1,750,850 | 1,750,850 | 1,750,850 |
| R-squared | 0.004 | 0.071 | 0.352 | 0.353 | 0.386 | 0.387 | 0.387 | 0.388 |
| Number of Diagnoses | N/A | 755 | 755 | 755 | 755 | 755 | 755 | 755 |
In Table 1, it was found that Total Cost and Delay is positively correlated. In column (2), by only including diagnosis fixed effects, we find that, all else held constant, an additional day of delay led, on average, to a total cost that was 11.1 log points higher when compared to column (1). Without diagnosis fixed effects (column (1)), log total cost was 13.7 log points higher with additional delay. When adding hospital fixed effects in column (3), the coefficient decreased slightly to 10.7 log points. After adding all the controls in column (8) (payment category, admission type, admission source, residential type, severity code), the effect of an additional day of delay, on average and ceteris paribus, lead to a 10.6 log point (11.2%) increase in total cost. Results were found to be statistically significant (p<0.01). In column (8), for patients who identify as ‘self-pay,’ ‘private coverage’, and ‘other payer’, there is a 4.2, 0.6, and 0.6 log point decrease in total cost due to an additional unit of delay respectively, when compared to the omitted variable of ‘County Indigent Program’. County Indigent Programs cover low-income, uninsured patients. Patients who pay with ‘workers compensation’ have 5.1 log points more total cost due to delay than those who pay with the County Indigent Program. The results suggest that total cost due to delay is less when a patient pays for their own treatment compared with government funded payments. ‘Unscheduled’ patients, who account for 70.74% of patients, had a 0.3 log point increase in total cost for additional delay when compared to ‘scheduled’ patients. When considering patient admission source, patients coming from ‘prison/jail’ saw a 9.8 log point decrease in total cost for additional delay when compared to patients coming from ‘home’. For residential type, ‘homeless’ patients had an increased total cost of 11.5 log points compared to ‘local residents’ for additional delay. Patients who have a severity code ‘presence of major complication/comorbidity’ (CC) have a 20.1 log point increase in cost compared to patients with only a ‘presence of CC’. Patients with ‘no presence of CC or major CC’ have a 16.5 log point increase in total cost compared to ‘presence of CC’ for increased delay.
When analyzing the R-squared value in column (2), when only including diagnosis fixed effects, there is 7.1% variation when compared to the fitted regression line and a 11.1 log point increase in total cost for a unit increase in delay. However, in column (3), the R-squared value increases to 35.2% of explained variation when adding hospital fixed effects. Much of the variation seems to be explained by differences in hospital management and pricing than differences between medical diagnoses.
Table 2 column (9) builds upon column (8) from Table 1 and uses equation (3) to set Delay as a dummy variable so that each additional day of delay can be compared to the omitted variable (0 days of delay). Table 2 shows that when compared with Day 0 of Delay (no delay), a delay of one day increased total cost by 13.2 log points (14.1%) with the overall sum of Total Cost equal to $40,619.3USD, 26.6 log points (30.5%) the second day ($46,443.9USD overall), 38.2 log points (46.5%) for the third day ($52,156.3USD overall), 48.8 log points (62.9%) the fourth day ($57,988.5USD overall) and 57.9 log points (78.4%) for the fifth day ($63,513.0USD overall). If we compare a delay of six days to no delay, we find an increased total cost of 66.8 log points (95%), ($69,424.8 overall), approximately double the cost of treatment of Delay Day 0 (no delay) of $35,596.4USD. Day 0 cost was calculated using the constant value found in Table 1 and Table 2 (10.48). All values in Table 2 are statistically significant (p<0.01).
| (9) | (10) | (11) | (12) | |
| ln(Total Cost) | % Total Cost | |||
| Delay | Coefficient | Coefficient as % | Additional Total Cost ($USD) | Overall Sum Total Cost ($USD) |
| Day 1 | 0.132*** | 14.1 | 5022.9 | 40,619.3 |
| (0.0344) | ||||
| Day 2 | 0.266*** | 30.5 | 10,847.5 | 46,443.9 |
| (0.0332) | ||||
| Day 3 | 0.382*** | 46.5 | 16,559.9 | 52,156.3 |
| (0.0289) | ||||
| Day 4 | 0.488*** | 69.2 | 22,392.1 | 57,988.5 |
| (0.0290) | ||||
| Day 5 | 0.579*** | 78.4 | 27,916.6 | 63,513.0 |
| (0.0305) | ||||
| Day 6 | 0.668*** | 95.0 | 33,828.4 | 69,424.8 |
| (0.0303) | ||||
| Day 7 | 0.749*** | 111.5 | 39,685.9 | 75,282.3 |
| (0.0318) | ||||
| Day 8 | 0.813*** | 125.5 | 44,661.5 | 80,257.9 |
| (0.0333) | ||||
| Day 9 | 0.884*** | 142.1 | 50,566.9 | 86,163.3 |
| (0.0354) | ||||
| Day 10 | 0.942*** | 156.5 | 55,712.2 | 91,308.6 |
| (0.0387) | ||||
| Day 11 | 0.993*** | 169.9 | 60,489.7 | 96,086.1 |
| (0.0413) | ||||
| Day 12 | 1.012*** | 175.1 | 62,332.8 | 97,929.2 |
| (0.0433) | ||||
| Constant | 10.48*** | $35,596.4 | ||
| (0.0628) | ||||
| Observations | 1,750,850 | |||
| Number of Diagnoses | 755 | |||
| R-squared | 0.390 |
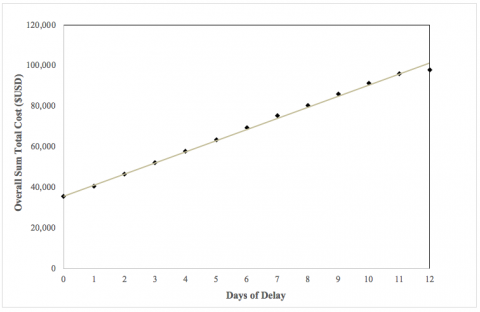
Figure 2 shows that there is an approximate linear relationship between days of delay and the overall sum of total cost of treatment when factoring in diagnosis fixed effects, hospital fixed effects, and all patient control variables.
When running a regression of log Total Cost on Delay, it was found that, on average and ceteris paribus, an additional day of delay resulted in a 10.6 log point increase in total cost (11.2%) when accounting for diagnosis fixed effects, hospital fixed effects, and controlling individual patient characteristic variables such as payment category, admission type, admission source, patient residence type, and severity code. An 11.2% increase in total cost is economically significant for policymakers, insurance companies, hospital administrators, and patients. Furthermore, it is worthwhile to consider why delays continue to occur, which patients may be most affected, and to what degree.
As a result of severe resource shortages, patients who exhibit potential coronavirus symptoms are told to monitor their health at home and only seek medical attention once symptoms impact the ability to breathe (CDC, 2020). The severity of coronavirus symptoms might not present immediately, so patients may delay treatment for several days (Cleveland Clinic, 2020). In addition to patients who are being affected directly by the coronavirus, there are additional patients affected by inefficient and delayed medical care. Patients who require other medical procedures, such as cancer treatment and surgeries, are being cast as lower priority. Operating rooms are being used as intensive care units and surgeons are being reassigned to directly treat coronavirus patients (Grady, 2020). One in four cancer patients reported delays in their cancer treatment due to the pandemic (American Cancer Society, 2020). This study found that when compared with Day 0 (no delay), a delay of one day increased total cost by 14.1% ($40,619.3USD overall total cost), 30.5% the second day ($46,443.9USD overall), 46.5% the third day ($52,156.3USD overall), 62.9% the fourth day ($57,988.5USD overall), and 78.4% the fifth day ($63,513.0USD overall).
In addition, the virus disproportionately affects lower income communities (Wilson, 2020). Treatment delays may hike up healthcare costs that low-income families cannot afford. Many lower-income breadwinners now face unemployment, little to no insurance, or continue to work even with the risk of coronavirus infection (Miller et al., 2020). In an attempt to save money now, they may delay seeking medical attention (Saad, 2019; Smolderen et al., 2011). This study found that if a patient delays treatment for two days, when compared to no delay, the total price of treatment increases by 30.5%, equating to an overall cost of $46,443.9USD for treatment. The ‘low-income’ cutoff for a family of four was $48,678USD in 2016 (NCCP, 2018). Hence, delaying treatment by even two days equates to total costs approximately equal to an entire year of income. This study also found that for patients who identify as ‘self-pay’ and ‘private coverage’, there is a 4.2 log point and 0.6 log point decrease in Total Cost for an additional day of delay when compared to patients paying through the ‘County Indigent Program’. Hence, in terms of total cost, lower-income patients are more affected by increased delays.
In a study investigating patients under the age of 5 years old, hospitalization costs were 1.9% higher with delay (Kraft et al., 2009). In another study involving children with acute appendicitis, delaying surgery more than 12 hours significantly increased costs (Yardeni et al., 2004). Older adult patients are more prone to treatment delays and were disproportionately represented among patients who waited longer than 24 hours for emergency surgery. In addition to the clinical risks of delayed and out-of-hours surgery, such practices incur significant additional costs (O’Leary et al., 2014).
Moreover, in California, African American and Hispanic inmates are overrepresented in California’s prison systems (Harris et al., 2020), which have suffered from significant coronavirus outbreaks (Williams et al., 2020). African Americans have also disproportionately been affected by coronavirus (Shullman et al., 2020). We found that patients coming from ‘jail/prison’ saw a 9.8 log point decrease in total cost for additional delay when compared to patients coming from ‘home’; such a finding may impact treatment triage for inmates.
Looking beyond demographic factors, previous literature has suggested delay may be procedure-specific. For patients treated for an appendectomy, as time to receive treatment increased (above two and a half hours), patients required a greater number of attending doctors (Qadar et al., 2014). In acute cholecystitis cases, it was found that:
Ensuring cholecystectomy within 24 hours for cholecystitis could mitigate costs associated with longer hospitalization. The average cost of care for surgery on the admission day was $11,087. Costs disproportionately increased by 22% on the second hospital day ($13,526), by 37% on the third day ($15,243), by 52% on the fourth day ($16,822), by 64% on the fifth day ($18,196), by 81% on the sixth day ($20,125), and by 100% on the seventh day ($22,250) when compared with the cost of care for procedures performed within 24 hours of admission. (Schwartz et al., 2015).
Our results were consistent with Schwartz et al., (2015), even when we expanded the scope of our study to encompass more diagnoses.
Nonetheless, a limitation of this study was omitting socioeconomic and demographic data due to HIPAA regulation, such as socioeconomic status, age, race and gender. By redacting patient demographic variables, we cannot directly investigate if there is a correlation between treatment delay and gender, age or racial discrimination. Moreover, although many controls were included in this study, omitted variable bias may have been present. For example, an increase in delay may be due to waiting for an organ donor for a transplant, which may also be costlier procedures (Bradley, 2020). The time the patient received the diagnosis may also factor into delay and cost. If a patient was diagnosed after-hours, there may be fewer hospital staff, so scheduling treatment may be delayed, and after-hours care may incur additional costs that are not present during normal hours.
With the introduction of a new ICD-10-CM code for the coronavirus (CDC, 2020), it may be worthwhile to conduct this study again on updated data that includes coronavirus patients. In this case, “coronavirus diagnosis” could be added as an additional dummy variable to the regression equation (3). In addition to total cost, other healthcare outcomes such as rate of readmission, length of hospital stay, and death could be added as interaction terms to this study.
In conclusion, the most significant finding of this study found that on average, total cost increased by 11.2% for an additional unit of delay. When comparing subsequent days of delay, cost continues to increase when compared to no delay. All in all, the results can aid in cost-benefit analyses when evaluating against other economic and social factors.
2014 Californian Public Patient Discharge Data: https://dss.princeton.edu/catalog/resource187
American Cancer Society. (2020, April 15). Survey: COVID-19 Affecting Patients’ Access to Cancer Care. https://www.fightcancer.org/releases/survey-covid-19-affecting-patients%E2%80%99-access-cancer-care
American Hospital Association. (2020, April 1). Coronavirus Update: Caring with Limited Resources During the COVID-19 Crisis: A Compilation of Resources for Your Team. https://www.aha.org/advisory/2020-04-01-coronavirus-update-caring-limited-resources-during-covid-19-crisis-compilation
Bradley, C. (2020, April 20). Top 10 Most Expensive Medical Procedures. Investopedia. https://www.investopedia.com/financial-edge/0310/top-10-most-expensive-medical-procedures.aspx
Centers for Disease Control and Prevention. (2020, April 28). Coronavirus Disease 2019 (COVID-19): Cases in the U.S. https://www.cdc.gov/coronavirus/2019-ncov/cases-updates/cases-in-us.html
Centers for Disease Control and Prevention. (2020, April 28). Coronavirus Disease 2019 (COVID-19): What to Do If You Are Sick. https://www.cdc.gov/coronavirus/2019-ncov/if-you-are-sick/steps-when-sick.html
Centers for Disease Control and Prevention. (2020, April 1). New ICD-10-CM code for the 2019 Novel Coronavirus (COVID-19), April 1, 2020.
https://www.cdc.gov/nchs/icd/icd10cm.htm
Cleveland Clinic. (2020, April 4). No Signs of Coronavirus? Here’s Why You Could Still Be Carrying (and Spreading) It. https://health.clevelandclinic.org/studies-show-carriers-with-mild-or-no-symptoms-are-key-part-of-covid-19-spread/
Grady, D. (2020, April 20). The Pandemic’s Hidden Victims: Sick or Dying, but Not From the Virus. The New York Times. https://www.nytimes.com/2020/04/20/health/treatment-delays-coronavirus.html
Harris, H., Goss, J., Hayes, J., Gumbs, A. (2020). California’s Prison Population. Public Policy Institute of California. https://www.ppic.org/publication/californias-prison-population/
Kraft, A., Quimbo, S., Solon, O., Shimkhada, R., Florentino, J., Peabody, J., (2009, August). The Health and Cost Impact of Care Delay and the Experimental Impact of Insurance on Delays: Evidence from a Developing Country. NCBI PMC. J Peadiatr. 155(2): 281–5.e1. doi: 10.1016/j.jpeds.2009.02.035. http://www.ncbi.nlm.nih.gov/pmc/articles/PMC2742317/
Miller, C., Kliff, S., Sanger-Katz, M. (2020, March 1). Avoiding Coronavirus May Be a Luxury Some Workers Can’t Afford. The New York Times. https://www.nytimes.com/2020/03/01/upshot/coronavirus-sick-days-service-workers.html
National Center for Children in Poverty. (2018). United States Demographics of Low-Income Children. Bank Street Graduate School of Education. http://www.nccp.org/profiles/US_profile_6.html
O’Leary, D., Beecher, S., McLaughlin, R. (2014, December). Emergency surgery pre-operative delays – Realities and economic impacts. NCBI PubMed. International Journal of Surgery: 12(12):1333-6. doi: 10.1016/j.ijsu.2014.10.002. https://www.ncbi.nlm.nih.gov/pubmed/25462705
Pickert, R., Qiu, Y., McIntyre, A. (2019, October). U.S. Recession Model at 100% Confirms Downturn Is Already Here. Bloomberg. Updated April 8, 2020. https://www.bloomberg.com/graphics/us-economic-recession-tracker/
Qadar, S., Maeda, Y., Akram, J., Madsen, M. (2014, March). Dedicated emergency departments delay surgical treatment of acute appendicitis. NCBI PubMed. Danish Medical Journal: Danish Medical Association. 61(3):A4791. https://www.ncbi.nlm.nih.gov/pubmed/24814912
Saad, L. (2019, December 9). More Americans Delaying Medical Treatment Due to Cost. Gallup. https://news.gallup.com/poll/269138/americans-delaying-medical-treatment-due-cost.aspx
Schwartz, D., Shah, A., Zogg, C., Nicholas, L., Velopulos, C., Efron, D., Schneider, E., Haider, (2015, July). Operative delay to laparoscopic cholecystectomy: Racking up the cost of health care. NCBI PubMed. Journal of Trauma and Acute Care Surgery: 79(1):15-21. doi: 10.1097/TA.0000000000000699. https://www.ncbi.nlm.nih.gov/pubmed/26091309
Shullman, S., & Evans, A. (2020, April 27). COVID-19 Does Discriminate — It Targets the Most Vulnerable. American Psychological Association. https://www.apa.org/news/press/op-eds/covid-19-discriminate-vulnerable
Smolderen, K., Spertus, J., Nallamothu, B., Krumholz, H., Tang, F., Ross, J., Ting, H., Alexander, K., Rathore, S., Chan, P. (2010, April 14). Health Care Insurance, Financial Concerns, and Delays to Hospital Presentation in Acute Myocardial Infarction. NCBI PMC. JAMA: 303(14): 1392–1400. doi: 10.1001/jama.2010.409 https://www.ncbi.nlm.nih.gov/pmc/articles/PMC3020978/
Tsai, T., Orav, E., Joynt, K. (2015, June). Disparities in Surgical 30-Day Readmission Rates for Medicare Beneficiaries by Race and Site of Care. NCBI PubMed. 259(6):1086-90. doi: 10.1097/SLA.0000000000000326. https://www.ncbi.nlm.nih.gov/pubmed/24441810
Williams, T., Weiser, B., Rashbaum, W. (2020, March 31). ‘Jails Are Petri Dishes’: Inmates Freed as the Virus Spreads Behind Bars. The New York Times. https://www.nytimes.com/2020/03/30/us/coronavirus-prisons-jails.html
Wilson, C. (2020, April 15). These Graphs Show How COVID-19 Is Ravaging New York City’s Low-Income Neighborhoods. Time. https://time.com/5821212/coronavirus-low-income-communities/
Yardeni, D., Hirschi, R., Drongowski, R., Teitelbaum, D., Geiger, J., Coran, A. (2004, March). Delayed versus immediate surgery in acute appendicitis: do we need to operate during the night? NCBI PubMed. J Pediatr Surg. 39(3):464-9; discussion 464-9. https://www.ncbi.nlm.nih.gov/pubmed/15017571
| VARIABLE | VALID FREQUENCY | VALID % OF SAMPLE |
| Total Cost ($USD) | 1,750,850 | 100 |
Delay (Days) Day 0 Day 1 Day 2 Day 3 Day 4 Day 5 Day 6 Day 7 Day 8 Day 9 Day 10 Day 11 Day 12 Total |
875,425 437,712 146,721 116,256 87,017 28,363 24,511 21,185 3,501 2,976 2,626 2,276 1,925 1,750,850 |
50.00 25.00 8.38 6.64 4.97 1.62 1.40 1.21 0.20 0.17 0.15 0.13 0.11 100 |
Payment Category County Indigent Program Medi-Cal Medicare Other Government Other Indigent Other Payer Private Coverage Self Pay Workers Compensation Total |
4,770 554,181 585,555 35,539 1,371 12,122 493,515 49,379 14,418 1,750,850 |
0.27 31.65 33.44 2.03 0.08 0.69 28.19 2.82 0.82 100 |
Admission Type Scheduled Unscheduled Total |
512,268 1,238,582 1,750,850 |
29.26 70.74 100 |
Admission Source Home Residential Care Facility Ambulatory Surgery Skilled Nursing/Immediate Care Acute Inpatient Hospital Care Other Inpatient Hospital Care Prison/Jail Other |
1,602,102 9,365 12,749 41,498 46,797 7,590 7,603 23,146 1,750,850 |
91.50 0.53 0.73 2.37 2.67 0.43 0.43 1.32 100 |
Residential Type Local Foreign Homeless Total |
1,743,486 2,814 4,550 1,750,850 |
99.58 0.16 1.26 100 |
Severity Code Presence of CC Presence of MCC No presence of CC or MCC Total |
296,594 312,702 1,141,554 1,750,850 |
16.94 17.86 65.20 100 |
| ICD-9 CATEGORIES | FREQUENCY | VALID % OF SAMPLE |
| Infectious and Parasitic Diseases | 144,296 | 8.24 |
| Neoplasms | 83,588 | 4.77 |
| Endocrine, nutritional and metabolic diseases, and immunity disorders | 72,941 | 4.17 |
| Diseases of the blood and blood forming organs | 20,840 | 1.19 |
| Diseases of the nervous system | 37,603 | 2.15 |
| Diseases of the sense organs | 4,530 | 0.26 |
| Diseases of the circulatory system | 248,271 | 14.18 |
| Diseases of the respiratory system | 139,992 | 8.00 |
| Diseases of the digestive system | 203,419 | 11.62 |
| Diseases of the genitourinary system | 86,079 | 4.92 |
| Complications of pregnancy, childbirth and the puerperium | 318,947 | 18.22 |
| Diseases of the skin and subcutaneous tissue | 37,150 | 2.12 |
| Diseases of the musculoskeletal system and connective tissue | 114,622 | 6.55 |
| Congenital anomalies | 9,288 | 0.53 |
| Symptoms, signs and ill-defined conditions | 67,278 | 3.84 |
| Injury and poisoning | 161,965 | 9.25 |
| TOTAL | 1,750,850 | 100 |
Lamiah Anne Haque is a current M.S. in Physiology & Biophysics candidate at Georgetown University. Prior to that, she received her B.A. in Economics at Princeton University. Her interests lie in public health, healthcare equity, biotechnology, and research in tumor biology and neurodegenerative diseases.
HPHR.org was designed by ComputerAlly.com.
Visit HPHR’s publisher, the Boston Congress of Public Health (BCPH).
Email communications@bcph.org for more information.
Click below to make a tax-deductible donation supporting the educational initiatives of the Boston Congress of Public Health, publisher of HPHR Journal.![]()