
Fredrick III E. Death, violence, health, and poverty in Chicago. Harvard Public Health Review. Fall 2018;19.
DOI:10.54111/0001/S1
I am by any estimation the product of a privileged upbringing. My father is a physician and my mother was an educator, author, and stay at home mom. I grew up on Chicago’s south side through 6th grade before moving to an affluent south suburb. The opportunities, education, and environment I experienced were at the opposite end of the spectrum from those had by people in the neighborhoods I am about to describe. I grew up around mostly white kids, in predominately white neighborhoods, and attended predominately white schools until I went to medical school at Howard University, in Washington D.C.
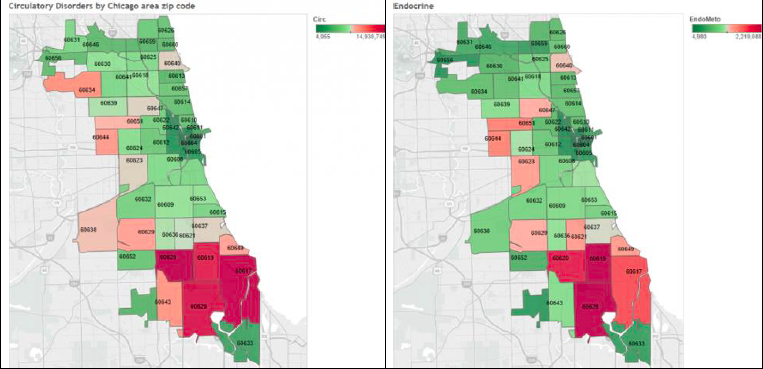
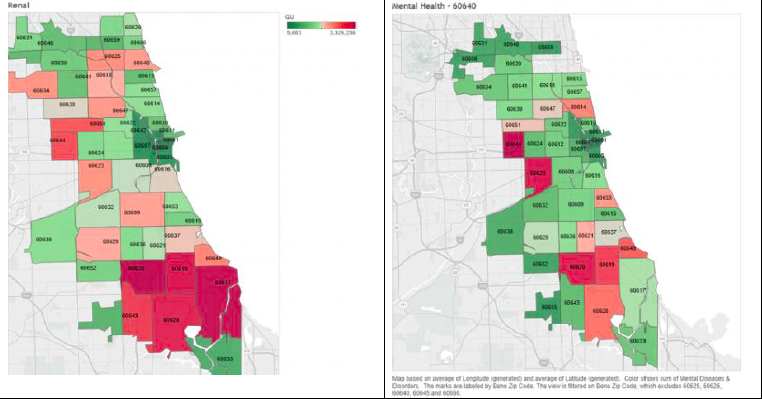
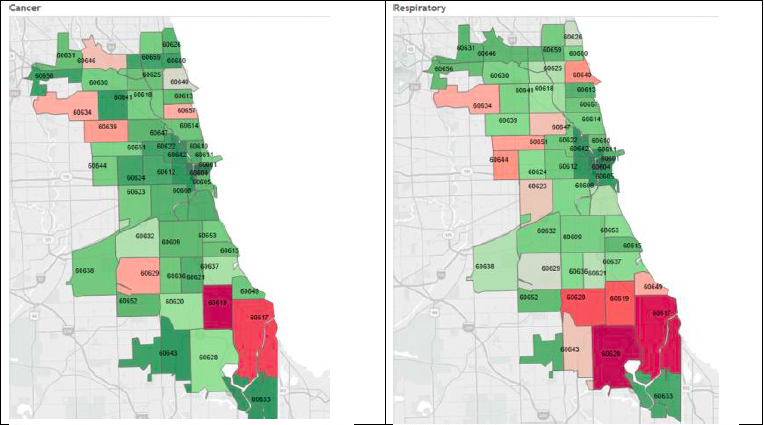
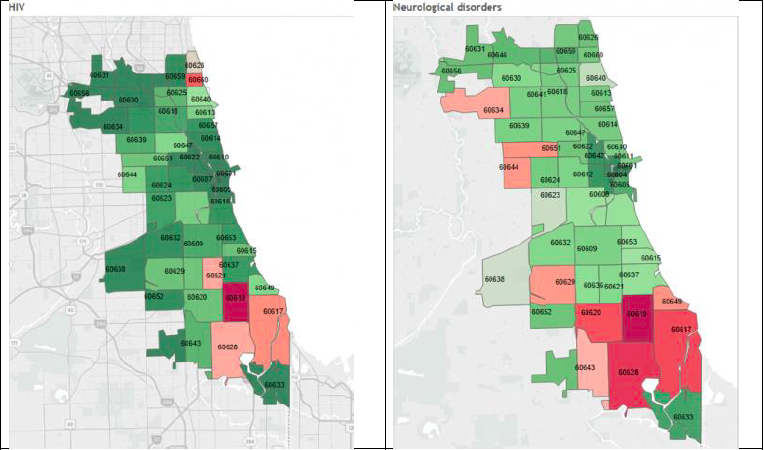
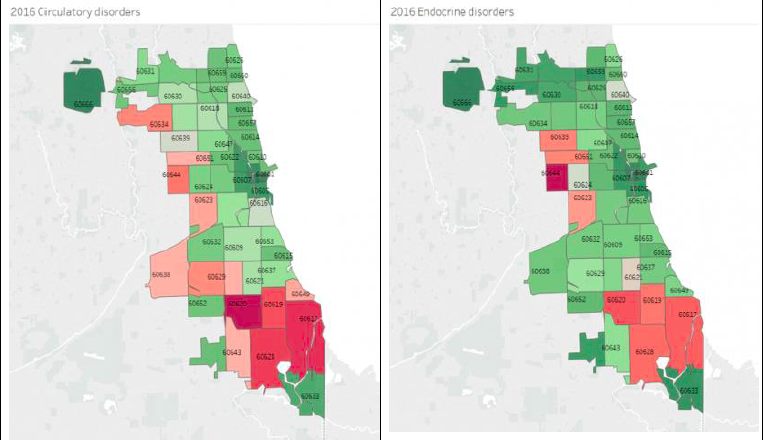
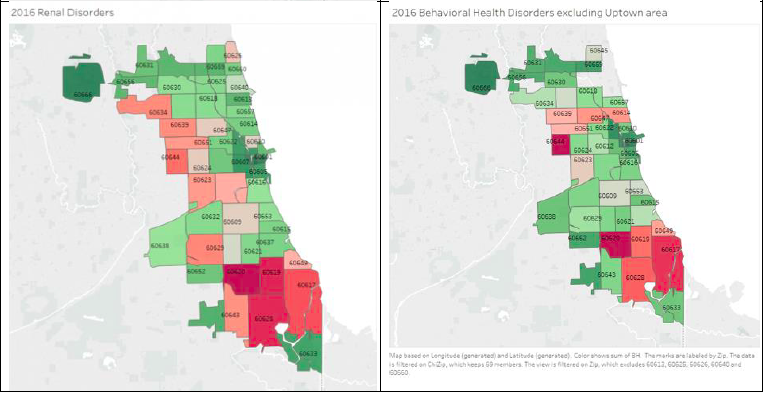
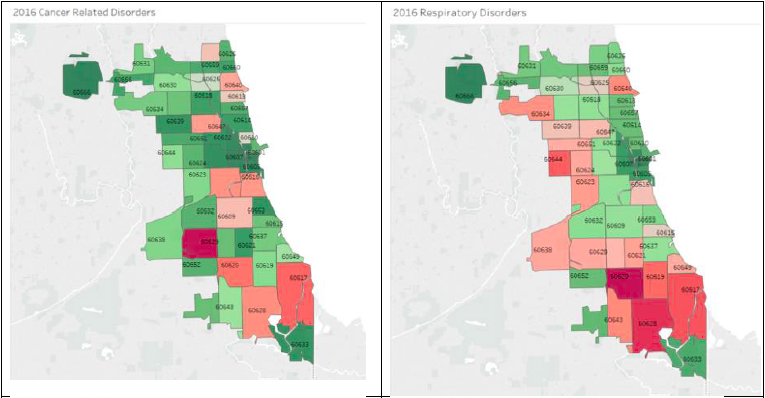
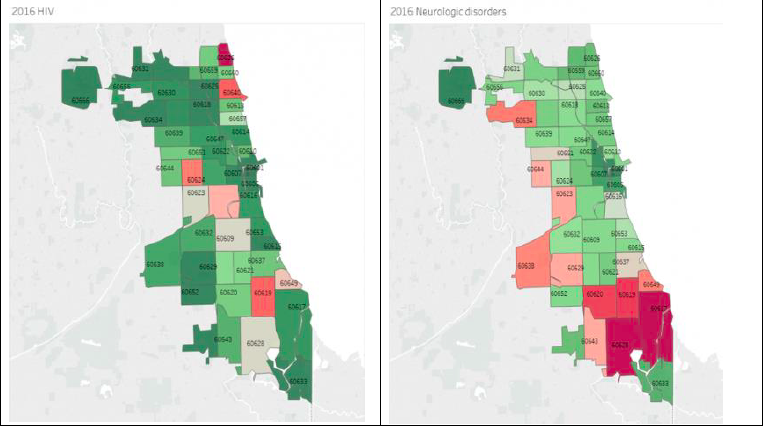
After my medical training, I worked in predominately African-American communities in and around Chicago’s South Side for 25 years. A decade ago, I began noticing extreme numbers of chronic disease with staggering complications. The intensity of chronic disease morbidity was higher in community hospitals on Chicago’s south side than in the University referral centers where I had previously worked and trained. A couple of years ago, I began to evaluate Medicare discharge data by zip code in Chicago. I found clusters of zip codes on Chicago’s south and west side that had the highest concentrations of cardiovascular, renal, endocrine, neurologic, and HIV disease in the city. This exploration coincided with extensive press on Chicago as a city challenged by violence, especially gun-related violence. The same neighborhoods with extremes of chronic disease also experienced extreme poverty, residential racial segregation, and gun violence. Indeed, there appeared to be a strong link between poverty, poor education, poor health, early death, racial residential segregation, and gun violence in Chicago.
Gun violence in Chicago is a public health emergency largely driven by poverty and inequity. Chicago is known as the city of neighborhoods. Residence in a neighborhood can impact your life expectancy, wealth, health, and the likelihood of encountering gun violence. Segregation drives the persistence of poverty, premature death, and violence in Chicago’s most challenging neighborhoods. An epidemiological approach to assessment and a public health approach to policy and mitigation are desperately needed to address violence in Chicago’s neighborhoods.
Pundits have suggested numerous “solutions” to gun violence in the city. The idea of “solutions” presupposes an understanding of causality. Typical solutions advocated include better neighborhood policing, tougher gun laws, sentencing reform for violent offenders, and expanding prison capacity. Yet all of these “solutions” point to a misunderstanding of the core issues. The purpose of this report is to shift the violent crime paradigm while examining the influence of structural and institutional segregation on health, poverty, and gun violence.
Violent crime is a disease. Attempting to use legal tools to resolve the epidemic misses the point and essential strategies to effect change. When alcoholics were found dead in their jail cells many years ago, alcohol abuse correctly became recognized as a health problem. The public also considered heroin addiction a criminal problem isolated to certain communities. Yet we now recognize opiate use as a public health concern, rather than a law enforcement issue. Similarly, gun violence is a public health problem. Gun violence is also an economic problem. In Chicago, the neighborhood you live in determines your health, wealth, life expectancy, and the likelihood that gun violence will directly affect you. Further, segregation is the core prevailing influence that perpetuates conditions that sustain and ensure ongoing violence in some Chicago neighborhoods.
This study leverages epidemiological tools, defined by the World Health Organization as approaches to study of the distribution and determinants of health-related states or events (including disease), to study the population of Chicago as it relates to violence (gun violence in particular), health, and wealth.
Gun violence is a multifactorial concern, not an individual problem, associated with the combined effects of individual, family, school, peer, community, and social risk factors interacting over time beginning in childhood and adolescence.1 From the individual perspective, the most powerful predictor is previous history of violent behavior. Guns result in 33,597 deaths annually in the US according to the Centers for Disease Control and Prevention (CDC). The majority of these deaths (excluding mass shootings) occur in economically challenged communities with high rates of individuals living at or below the poverty line.
Poverty predicts and is a major confounder of, homicide rates nationally according to the empiric literature. 2 According to the census bureau, 12.4% of the US population lives in poverty. For a family of 4 (2 adults and 2 children under 18 years old ), an income of $24,339 is the Federal poverty level (FPL). The Chicago Tribune noted: “The number of poor people living in neighborhoods with extreme poverty — the ones most likely to have conditions that foster violence — grew 384 percent from 2000 to 2015.”3 This statistic must be taken in the context of root causes and the implications and byproducts of poverty.
Racial residential segregation between whites and African Americans in Chicago dates to the Great Migration, which lasted from 1916 to approximately 1970. During that time, African Americans moved from the South to cities in the north. Many families found themselves in small enclaves that accepted Black residents. In Chicago, that meant the city’s south and south-west areas (often referred to as “sides”). Residential segregation was institutionalized through school segregation and redlining. Together, they created structural barriers to homeownership and rental agreements by Black families, essentially limiting local Black migration out of disadvantaged neighborhoods.
Redlining refers to the practice of mortgage lenders and insurers literally placing red lines through non-white neighborhoods, precluding them from accessing mortgages and insurance. The practice began informally in the early 1900s and was codified during the New Deal in the 1930s by the Home Owners Loan Corporation (HOLC). HOLC developed a color-coded map of the U.S. based on the racial mix to determine insurance and loan risk.4 5 Without access to loans or insurance, African Americans were barred from homeownership, one of the greatest sources of wealth development in the twentieth century. This structural and institutional racism and segregation ensured that African Americans and other non-whites could not build wealth or resources. The circumstances contributed to economic deprivation and violence in historically minority areas, while limiting the ability of African-Americans and other non-whites to move elsewhere.6 Violence can be understood as a byproduct of hopelessness and multigenerational deprivation, and remains endemic to predominately African-American and non-white neighborhoods in Chicago.
In Chicago, growing up in certain neighborhoods essentially guarantees a lifetime of poverty and frequent exposure to violence. The Chicago metro area is the third most racially-segregated metro area nationally behind Milwaukee, Wisconsin, New York City, New York, and Newark, New Jersey. Massey and Denton argue in their seminal 1993 treatise, American Apartheid that poverty is concentrated in non-white neighborhoods, not by coincidence but through systematic segregation. Moreover, racial segregation magnifies poverty’s influence within communities of color.7
Racial segregation also impacts the causes of death, life expectancy, birth weight, and infant mortality, and gun-related deaths. Indeed, studies show marked reductions in systolic blood pressure and overall better health outcomes among persons living in less segregated areas.8 9
The 2014 leading causes of death nationally in declining order of frequency were: 1. Heart Disease; 2. Cancer; 3. Chronic Lower Respiratory Disease; 4. Accidents; and 5. Strokes. Similar leading causes of death, with strokes at the lead, were reported in Illinois in 2014. In Chicago, however, the number one cause of death for persons ages 15-24 and 25-34 was homicide. These groups also were more likely than their counterparts across the country to experience under/unemployment, low educational attainment, community-based trauma and violence, and premature death due to homicide. The question is, are these relationships incidental or causal?
Much of this appears to stem from residential segregation. In 2016, one homicide occurred in each of the three “Whitest” neighborhoods in Chicago (Lakeview 80% White, O’Hare 77% White, and Near North 72% White), while the remaining predominantly white neighborhoods had none (Figure 3). In Chicago’s “Blackest” neighborhoods, homicides ranged from 3 in Riverdale (96% Black) and Burnside (98% Black), to 23 in Chatham (97% Black). Racial segregation also impacts mortality, life expectancy, and Infant mortality. Reductions in exposure to racial residential segregation are associated with reductions in systolic blood pressure[6].
Similar trends are seen in terms of life expectancy, which at the national level is 78.1 years for all persons, with women living slightly longer than men, at 80.6 years compared to 75.6 years. In Chicago, life expectancy in 2010 was 79.8 overall. Yet significant variance in life expectancy is associated with median household income in Chicago. Those with a median household income of $49,877 in 2010 had a life expectancy of 75 and 81 years life expectancy. The poorest neighborhoods, however, had a life expectancy of only 71 and 76 years, compared to that of neighborhoods with the highest median incomes, which reported life expectancies between 81 and 90 years of age. On average, lower-income neighborhoods had a life expectancy of 73.5 years compared to higher income neighborhoods, which had a life expectancy of 86 years: a more than 12-year gap. The neighborhoods with the lowest life expectancies in Chicago are predominantly African American, and 70% have the highest levels of gun violence.
Segregation and violence in low-income neighborhoods are also associated with low birth weight (LBW), defined as weight at birth less than 2500 grams, or 5.5 pounds, and infant mortality defined as the probability of dying between birth and 1 year of age. Both LBW and infant mortality are considered measures of population wellbeing, though the CDC often focuses on the individual-level determinants, such as maternal smoking, drinking, lack of weight gain, age, income, low educational attainment, stress, domestic/other abuse, marital status, and so on.
In Chicago’s poorest and most violent neighborhoods, 15-20% of mothers have LBW babies; rates that rival that of the world’s poorest nations, including Ethiopia (20%), Chad (20%), Nigeria (15%), and Benin (15%).10. Moreover, 30% of Chicago neighborhoods with the highest percentage of LBW infants also have the highest rate of gun violence and 40% of neighborhoods with the highest homicide rates also highest rates of LBWs.
Similar trends are seen in terms of infant mortality. From 2005-2011, infant mortality in Chicago overall was 8.1 per 1000 live births. Yet the rates of infant mortality in the city’s poorest communities ranged from 13.4 to 22.6 per 1000 live births — similar to that found in developing nations like Belize and El Salvador (both with infant mortality rates of 13 per 1,000 live births ) and Vanuatu and the Philippines (22 per 1000 live births).11 Age-adjusted gun violence in 40% of these communities had the highest infant mortality rates in the city. These communities also had the lowest median household income (0-$40,000), life expectancy, public services and educational opportunities, and the highest rates of unemployment, overall violence, poverty, and income inequality.12
Firearm violence in Chicago is concentrated in neighborhoods with high levels of unemployment, low median household and per capita income, high infant mortality rates, and low overall life expectancy. From 2015 and 2016, Chicago experienced 58 percent more homicides and 43 percent more non-fatal shootings.
The incidence of violent crime and gun violence in Chicago is markedly disparate across neighborhoods.
The Metropolitan Planning Council in partnership with the Urban Institute recently described segregation as a cost to all Chicagoans. In their 2017 publication, The Cost of Segregation, they describe Chicago as having the 5th highest African American-White segregation and economic segregation combined of 100 US cities studied1. They estimate the cost of Chicago’s variance from median levels of segregation at $4.4 billion for the region and $2982 per person for African Americans. Segregation costs futures, lives, and money. Chicago is historically perhaps the poster child for institutional racism, systemic segregation that began in the early 1900s during The Great Migration. As African Americans migrated from the South in search of jobs, they were isolated in South Side neighborhoods and ultimately sky scraping housing projects. Martin Luther King Jr. came to Chicago in 1966 to march for fair housing. King remarked: “I have seen many demonstrations in the South, but I have never seen anything so hostile and as hateful as I’ve seen here today,” he said. King took a stone to the head and was rushed past several South Side hospitals and taken to Cook County hospital to be treated for his head wound.
Chicago has created marginalized communities marred by violence and gun-related deaths, fueled by institutional racism and systemic racial and economic segregation. There are not enough laws, police, or jails, to arrest this public health crisis.
Among neighborhoods that reported the highest concentrations of poverty between 2005 to 2009, all were predominantly African American and one-half had the highest homicide rates based on age-adjusted data per 100,000 persons (Table 1). Chicago’s richest and predominantly White neighborhoods (Lakeview, O’Hare, and Near North) each reported one murder annually between 2005-2009. Neighborhoods with lower incomes and larger African-American populations reported significantly higher numbers homicides, ranging from 3 (in Riverdale and Burnside) to 23 (Chatham) annually.
Again, we are confronted with the notion of causality. Could stricter laws and sentencing guidelines reduce violence and improve other determinants of health? The simple answer is no. Spikes in mass incarceration has led only made Chicago’s most vulnerable communities more dangerous.
In Chicago, neighborhoods define mass incarceration in terms of dollars spent and lives lost. Chicago’s “million dollar blocks,” city blocks where a million dollars or more is spent on incarceration, occur with alarming frequency in neighborhoods with high unemployment, high gun violence, and low life expectancy. The million dollar neighborhoods for 2015 were (in order of spending on incarceration): Austin $550 million, Humboldt Park $293 million, North Lawndale $241 million, West Englewood $197 million, and Roseland $159 million. Why have the affected neighborhoods become more dangerous? Sampson and Loeffler contend that mass incarceration can be systematically mapped based on social characteristics: the combination of poverty, unemployment, family disruption, and racial isolation. The result is a negative feedback loop that traps certain communities in a state of perpetual crime and poverty13
Applying population-based epidemiological analysis to the gun violence issue in Chicago, a few things are clear. We are on a path that will sustain and deepen levels of violence due to oppressive conditions. Oppression and despair invariably result from poverty, unemployment, income inequality, and racial and economic segregation. We spend hundreds of millions in some neighborhoods to incarcerate while systemic segregation feeds a vicious cycle of violence that will remain unabated by community policing, increasing prison capacity, and tougher gun laws. Indeed, segregation and mass incarceration are critical neighborhood destabilizing forces that assure lower life expectancy, higher levels of infant mortality, and lost opportunities for population growth and development.
Gun violence is a disease resultant of generations of neglect, and concentrating racial and economic groups to the detriment of Chicago as a whole. The mass redirection of funds aimed at isolating, segregating, and incarcerating towards community and individual development, education, and desegregation is urgently needed. We urgently need safer communities that are multi-cultural and racially diversified. We urgently need to lift all Chicagoans to at least the level of “average” for the 100 most populous cities in America. Systematic desegregation, educational investment, and growth of jobs and incomes will improve the quality of life for Chicago from Riverdale, Englewood, and Burnside to Forest Glen, Near North, and O’Hare neighborhoods. Gun violence in Chicago is a public health emergency requiring a massive public health response to remediate a predictably worsening crisis.
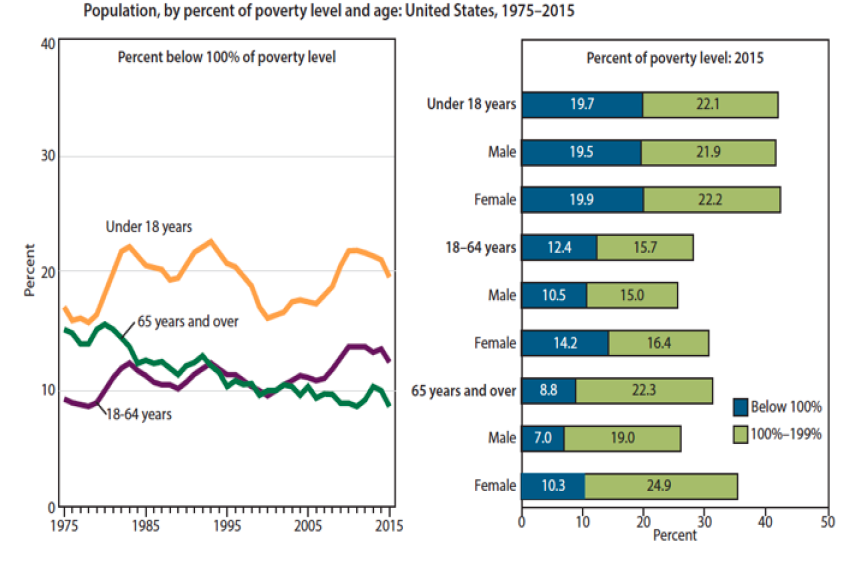
Table 1:
| Chicago Neighborhood | Percent Below Poverty Line | Chicago Neighborhood | Homicides Age Adjusted/100,000 persons 2005-2009 |
| Riverdale | 56.5 | Burnside | 70.3 |
| Full Park | 51.2 | Greater Grand Crossing | 49.7 |
| Englewood | 46.6 | Fuller Park | 49.6 |
| North Lawndale | 43.1 | West Englewood | 47.2 |
| East Garfield Park | 42.4 | North Lawndale | 46.7 |
| Washington Park | 42.1 | Chatham | 45.2 |
| West Garfield Park | 41.7 | Englewood | 45.1 |
| Amour Square | 40.1 | Washington Park | 44.6 |
| Oakland | 39.7 | West Pullman | 43.9 |
| West Englewood | 34.4 | South Deering | 41.3 |
Table 2:
| Chicago Neighborhood | Percent Population Black | Chicago Neighborhood | Gun Violence 2005-2009 per 100,000 persons | Chicago Neighborhood | Percent Below Poverty Line |
| Auburn Gresham | 97.8% | Burnside | 70.3 | Riverdale | 56.5 |
| Burnside | 97.7% | West Pullman | 46.5 | Fuller Park | 51.2 |
| Roseland | 97.4% | Englewood | 44.9 | Englewood | 46.6 |
| Englewood | 97.4% | Greater Grand Crossing | 44.6 | North Lawndale | 43.1 |
| Washington Heights | 97.4% | Washington Park | 39.5 | East Garfield Park | 42.4 |
| Chatham | 97.2% | West Englewood | 39.3 | Washington Park | 42.1 |
| Washington Park | 97.0% | Chatham | 37.9 | West Garfield Park | 41.7 |
| Greater Grand Crossing | 96.9% | Roseland | 37.7 | Amour Square | 40.1 |
| Riverdale | 96.4% | North Lawndale | 37.6 | Oakland | 39.7 |
| West Englewood | 96.3% | East Garfield Park | 37.1 | West Englewood | 34.4 |
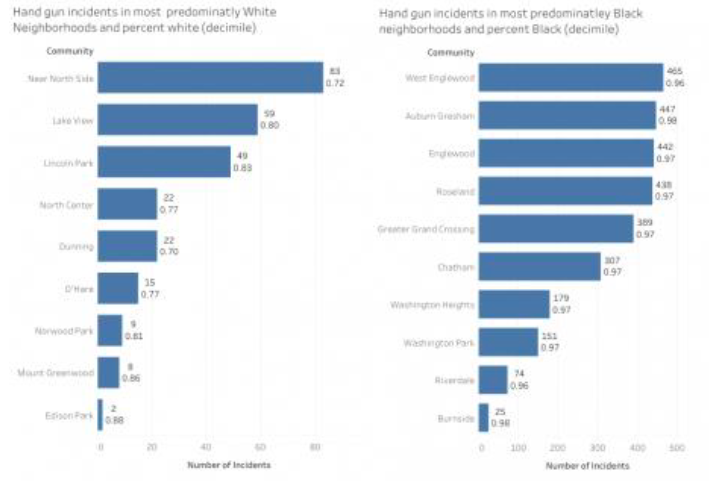
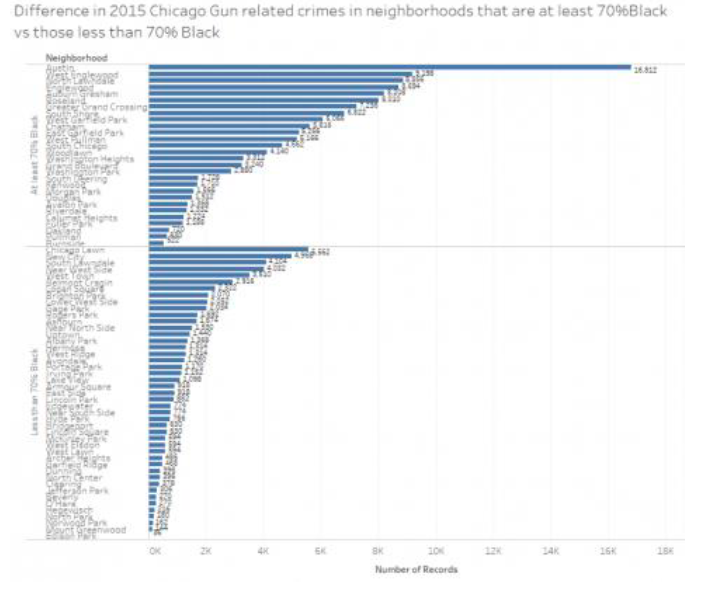
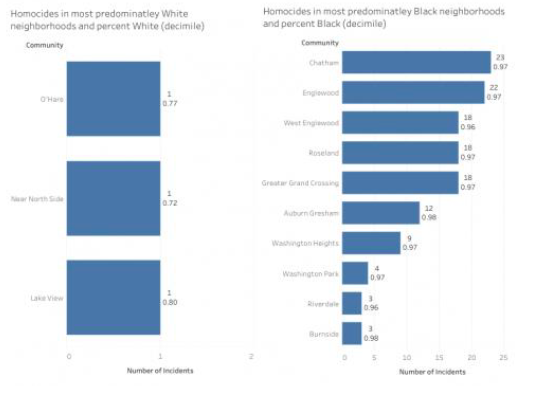
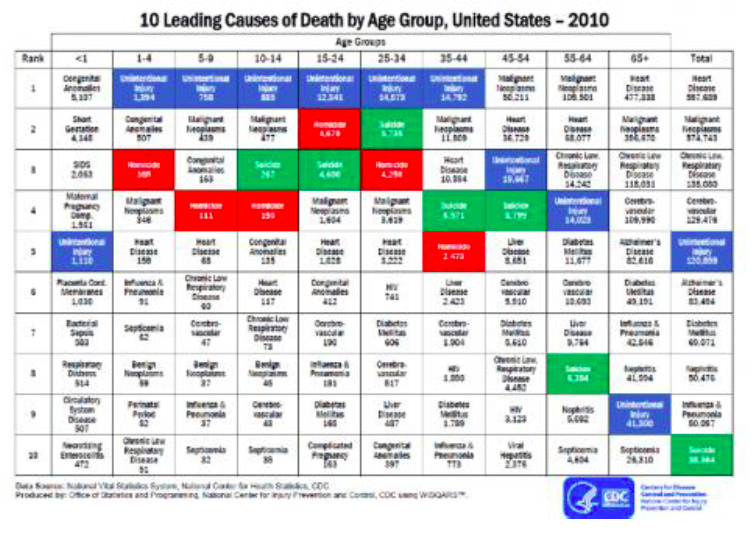
Table 3:
| All Causes of Death, 2014 | 105,296 Deaths | Percent of Total |
| Diseases of heart | 25,020 | 23.8% |
| Malignant neoplasms | 24,504 | 23.3% |
| Chronic lower respiratory diseases | 5,633 | 5.3% |
| Cerebrovascular diseases | 5,490 | 5.2% |
| Accidents (unintentional injuries) | 4,642 | 4.4% |
| Motor vehicle accidents | 1,064 | 1.0% |
| All other accidents | 3,578 | 3.4% |
| Alzheimer’s disease | 3,267 | 3.1% |
| Diabetes mellitus | 2,712 | 2.6% |
| Nephritis, nephrotic syndrome and nephrosis | 2,517 | 2.4% |
| Influenza and pneumonia | 2,483 | 2.4% |
| Septicemia | 1,804 | 1.7% |
| Intentional self-harm (suicide) | 1,396 | 1.3% |
| Chronic liver disease and cirrhosis | 1,321 | 1.3% |
| Parkinson’s disease | 1,116 | 1.1% |
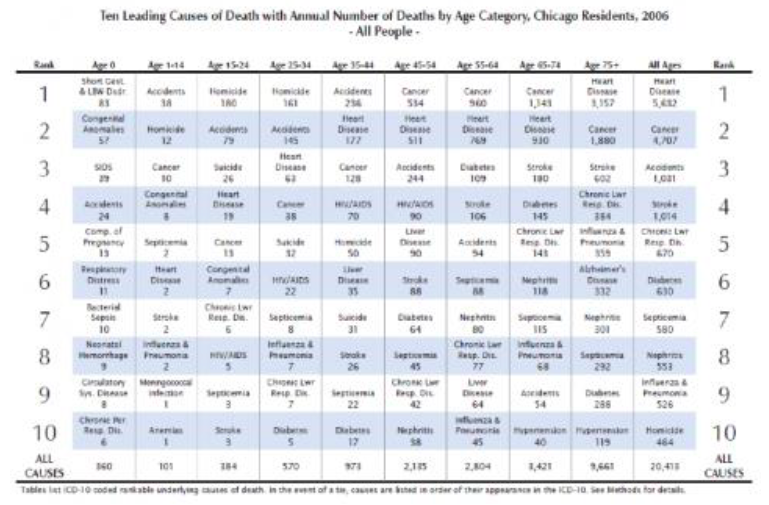
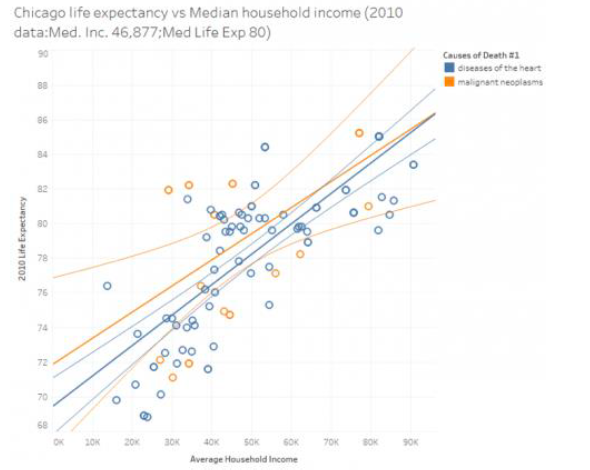
Table 4:
Community | Average Life Expectancy | Community | Gun violence 2005-2009 Per 100,000 Persons |
West Garfield Park | 68.8 | Burnside | 70.3 |
Washington Park | 68.9 | West Pullman | 46.5 |
Full Park | 69.8 | Englewood | 44.9 |
West Englewood | 70.1 | Greater Grand Crossing | 44.6 |
Englewood | 70.7 | Washington Park | 39.5 |
Greater Grand Crossing | 71.1 | West Englewood | 39.3 |
West Pullman | 71.6 | Chatham | 37.9 |
East Garfield Park | 71.7 | Roseland | 37.7 |
Austin | 71.9 | North Lawndale | 37.6 |
Burnside | 71.9 | East Garfield Park | 37.1 |
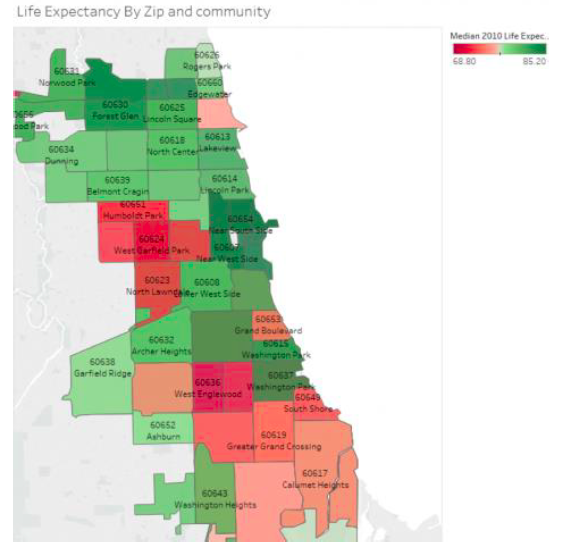
Table 5:
Community | 2009 Percent of Live Births Low Birth Weight | Community | Gun Violence 2005-2009 Per 100,000 persons | Community | Homicide Age Adjusted/100,000 Persons 2005-2009 |
Avalon Park | 19.7 | Burnside | 70.3 | Burnside | 70.3 |
Washington Heights | 19.6 | West Pullman | 46.5 | Greater Grand Crossing | 49.7 |
Washington Park | 17.7 | Englewood | 44.9 | Fuller Park | 49.6 |
East Garfield Park | 17.5 | Greater Grand Crossing | 44.6 | West Englewood | 47.2 |
Woodlawn | 17.4 | Washington Park | 39.5 | North Lawndale | 46.7 |
Full Park | 17.1 | West Englewood | 39.3 | Chatham | 45.2 |
West Garfield Park | 17 | Chatham | 37.9 | Englewood | 45.1 |
West Englewood | 16.1 | Roseland | 37.7 | Washington Park | 44.6 |
Austin | 15.4 | North Lawndale | 37.6 | West Pullman | 43.9 |
Chatham | 15.4 | East Garfield Park | 37.1 | South Deering | 41.3 |
Table 6:
Community | Infant Mortality Rate Per 1000 Live Births 2005-2009 | Community Gun Violence | Age Adjusted/100,000 Persons 2005-2009 |
Fuller Park | 22.6 | Burnside | 70.3 |
Washington Park | 19.3 | Greater Grand Crossing | 49.7 |
West Garfield Park | 19 | Fuller Park | 49.6 |
South Chicago | 17.7 | West Englewood | 47.2 |
Auburn Gresham | 15.6 | North Lawndale | 46.7 |
Greater Grand Crossing | 14.2 | Chatham | 45.2 |
North Lawndale | 14.1 | Englewood | 45.1 |
Calumet Heights | 13.9 | Washington Park | 44.6 |
Pullman | 13.6 | West Pullman | 43.9 |
Douglas | 13.4 | South Deering | 41.3 |
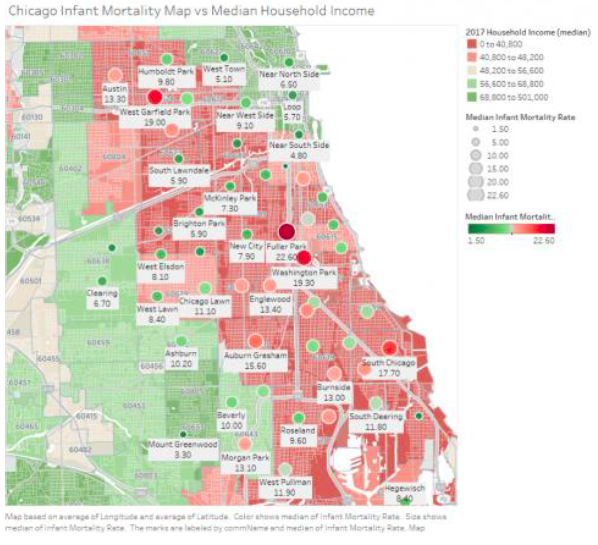
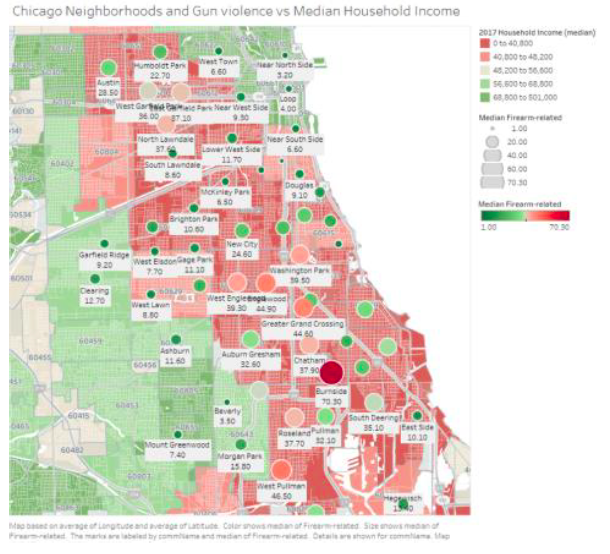
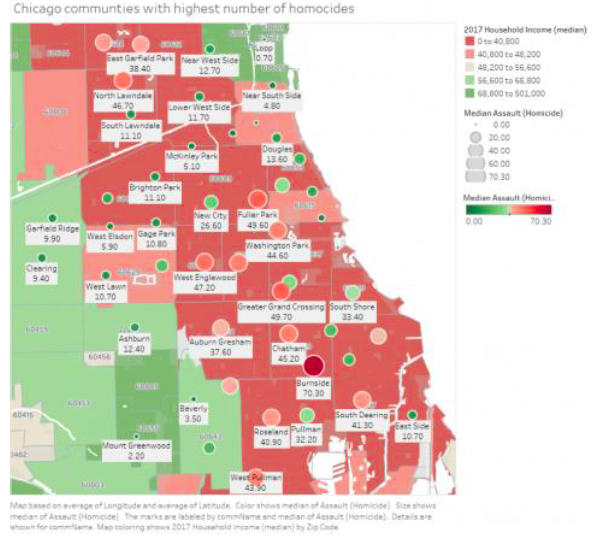
Table 7:
Neighborhood | Homicides | Wounded | Total | Percent Homicides | Percent Wounded | Percent of Total 2017 |
Austin | 71 | 335 | 406 | 12.3% | 13.2% | 13.0% |
Garfield Park | 27 | 199 | 226 | 4.7% | 7.8% | 7.2% |
North Lawndale | 35 | 183 | 218 | 6.1% | 7.2% | 7.0% |
Englewood | 44 | 173 | 217 | 7.7% | 6.8% | 7.0% |
Humboldt Park | 21 | 132 | 153 | 3.7% | 5.2% | 4.9% |
Auburn Gresham | 25 | 104 | 129 | 4.3% | 4.1% | 4.1% |
South Shore | 28 | 97 | 125 | 4.9% | 3.8% | 4.0% |
Roseland | 31 | 85 | 116 | 5.4% | 3.3% | 3.7% |
Gran Crossing | 16 | 95 | 111 | 2.8% | 3.7% | 3.6% |
New City | 16 | 78 | 94 | 2.8% | 3.1% | 3.0% |
Chicago Lawn | 15 | 73 | 88 | 2.6% | 2.9% | 2.8% |
West Pullman | 7 | 65 | 72 | 1.2% | 2.6% | 2.3% |
Little Village | 8 | 62 | 70 | 1.4% | 2.4% | 2.2% |
Chatham | 12 | 53 | 65 | 2.1% | 2.1% | 2.1% |
Near West Side | 14 | 49 | 63 | 2.4% | 1.9% | 2.0% |
All hers | 205 | 762 | 967 | 35.7% | 29.9% | 31.0% |
Tota | 575 | 2545 | 3120 | 100.0% | 100.0% | 100.0% |
Top communities (out of 77); percent of total for Chicago |
|
| 0% | 69% |
Earl Fredrick, III, MD, MBA is an emergency medicine physician in Chicago, Illinois and is affiliated with Jackson Park Hospital and Medical Center. He received his medical degree from Howard University College of Medicine and has been in practice for more than 20 years.
HPHR.org was designed by ComputerAlly.com.
Visit HPHR’s publisher, the Boston Congress of Public Health (BCPH).
Email communications@bcph.org for more information.
Click below to make a tax-deductible donation supporting the educational initiatives of the Boston Congress of Public Health, publisher of HPHR Journal.![]()