
Whetten J. What are we willing to pay to be unhealthy?: a Markov model for diabetes prevention. Harvard Public Health Review. Fall 2018;15. DOI:10.54111/0001/O4
To evaluate the cost-effectiveness of lifestyle changes compared to metformin use to manage diabetes, accounting for varying discount rates and determining the willingness-to-pay (WTP) to forgo alterations to diet and exercise routine.
This article uses data from the Diabetes Prevention Program group (DPP) and a Markov model to compare three treatments (placebo, Metformin, and lifestyle changes) for diabetes prevention.
We find that Metformin results in better-predicted outcomes than the placebo. We also find that lifestyle changes produce higher quality-adjusted life years (QALY) than Metformin or placebo. The cost savings outcome for lifestyle changes, however, is dependent on personal discounting and indirect cost of diet and exercise. At a standard discounting rate of 3%, people have a WTP of $3.30 ($2.74 – $3.86 CI) a day not to change diet and exercise habits.
Lifestyle changes have lower cost and higher QALYs. However, less than 1% of patients make these changes. This is due in part because of the high discounting rate for health behaviors. To improve patient adherence to medical advice, more attention needs to be given to discount rates.
Type 2 diabetes is preventable and, despite the availability of effective treatment, remains one of the most prevalent diseases. In 2014,1 29 million Americans had type 2 diabetes, and 89 million had prediabetes. This is a 35% increase over from 2009 to 2014. Diabetes cost Americans $322 billion in 2014 and has risen since. 2 The rising costs and prevalence of diabetes place a significant burden on individuals and the health-care system. Annual medical spending for people with diabetes is twice that of average. 3 The majority of patients diagnosed with type 2 diabetes were first initially diagnosed with prediabetes45Patients can delay or even prevent type-2 diabetes by losing weight, following a healthy diet, exercising, taking medication and monitoring their blood glucose levels. 6 The prevention of diabetes improves quality of life, increases life expectancy, and reduces lifetime medical costs3; yet patients are still not making these changes. There has been extensive work done on how diabetes can be prevented4,7,8,9,10 Few studies, however, address why patients chose not to follow this medical advice. Barriers to changes in health behavior include health literacy, motivation, and environmental.11We address this lack of health behavior changes by calculating patients’ willingness-to-pay (WTP) not to change. Any health intervention that helps patients make these lifestyle changes that costs less than the WTP will constitute cost savings.
The WTP is calculated by analyzing the cost-effectiveness of health interventions while accounting for an individual’s indirect cost and discount rate. The further in the future a person perceives that their health may decline, the less likely they are to consider the costs of such an outcome. The amount that this cost declines each year is called the discount rate. Current studies use a standard 3% discount rate, but the majority of patients with prediabetes and diabetes are overweight.6 Patients with a high body mass index (BMI) are shown to have a higher discount rate. 12 Patients that are diagnosed with prediabetes are told that without intervention their prediabetes will eventually progress to diabetes.10 The progression to diabetes, however, is in the future and the utility of an unhealthy lifestyle happens in the present. Daily health behavior choices need to be made in order to develop a healthier lifestyle. These choices are made on the margin and need to account for patients’ desire not to deviate from the status quo. In this article, we use a Markov model to determine how health behavior choices are made on the margin, while accounting for patients’ WTP not to change. The rest of this article is organized as follows. Section 2 provides background on the data and methodology used. Section 3 presents the empirical findings. Section 4 provides sensitivity analyses on findings, while section 5 concludes.
The data used in this study comes from the Diabetes Prevention Program group (DPP). The DPP ran a randomized controlled trial from 1997 to 2001 on prediabetes patients.13 They looked at 3,234 patients and randomly assigned them to one of three groups: placebo, Metformin, or lifestyle. The placebo group took a pill that had no effect on glucose absorption. The Metformin group took 850mg of Metformin twice a day. Metformin helps to lower blood glucose levels by increasing insulin sensitivity and reducing the amount of glucose produced and released by the liver. 14 The lifestyle group was given instruction and mentoring on healthy diet and exercise. They were required to exercise 15 minutes a day, five days a week. The lifestyle change group worked on reducing the contributing factors of excess weight and a diet overly high in sugar. This was referred to in the literature as an intensive lifestyle change.
Our Markov model looks at the effects of placebo, Metformin, and lifestyle changes (i.e., healthy diet and exercise) on the cost and quality-adjusted life years (QALY) of life with diabetes. The model is a simplified model of diabetes as a progressive disease, where patients move from prediabetes to diabetes. Patients begin in the prediabetes state and progress through the model until death. Patients are 30 years of age, male, and are classified as overweight. Thirty-year-old overweight males were used because they are the ones most commonly diagnosed with prediabetes. Patients in the prediabetes state can remain, move to diabetes, or die. Patients in the diabetes state can remain, or die. The treatment only takes place in the prediabetes state. Once a patient moves to a new health state, they start the standard practice of care for that health state.
The Markov Model gives total cost and effectiveness per patient, from which the Incremental Cost-Effectiveness Ratio (ICER) can be calculated for each intervention (equation 1). ICER represents the average incremental cost associated with one additional unit of the measure of effect. (1)
Where are the total cost and total effect in the intervention group? are the total cost and total effect in the control care group? Total cost is the summation of time spent in each health state multiplied by the cost of all health services incurred for that health state. The total effect is the summation of time spent in each health state multiplied by the QALY for that health state. The groups compared are Metformin vs. Placebo, Lifestyle vs. Placebo, and Lifestyle vs. Metformin.
The costs associated with the different health states and treatments were taken from the current literature. The cost for prediabetes varied by treatment (placebo, Metformin, direct lifestyle cost, and indirect lifestyle cost). Placebo has a cost of $0 as this is equivalent to taking no medication or making no lifestyle changes. Metformin use would cost a patient approximately $50 a year, based on insurance.15 Direct lifestyle costs come from changes in diet. A recent study by Harvard showed that eating a nutritious diet rather than an unhealthy one costs $1.50 more per day. For one person over the course of a year, a healthy diet would increase food costs by about $550 per year.16 Exercising also needs to be accounted for, but the exercises recommended do not require access to a gym or expensive equipment. Exercise can, however, result in an increase in indirect cost from disutility. The disutility stems from working out or the opportunity cost of leisure time lost. These indirect costs will be addressed later as they can vary from person to person. The cost of living with diabetes comes from the increase in medical costs for each health state. This increase in medical costs comes from the 2014 Change in Medical Spending Attributable to Diabetes: National Data from 1987 to 2011. This found that on average the cost of living with diabetes is $5,400.
The DPP study found that the placebo group had a transition from prediabetes to diabetes of 11% per year. The Metformin group had a 7% transition, and the lifestyle group had a 5% transition per year. The transition rates to death come from the federal social security life tables 17 and are adjusted by the morbidity multipliers for each health state. The mobility multiplier for diabetes came from the 2012 National Kidney Foundation (NKF) guidelines.18
The analysis conducted is an economic evaluation that estimates the cost per quality adjusted life-year (QALY) gained from undertaking one intervention instead of another. A QALY value of 1 is equivalent to a year of “perfect health,” whereas a value of zero corresponds to “death”. Utilities were considered for the following states: prediabetes (Placebo/Metformin/Lifestyle) (0.75-0.77) and diabetes (.63) 1920,21 These values were found using the Cost-Effectiveness Analysis Registry and their respective papers.
Using a discount rate of 3%22 gives the above ICERs. Table 4 shows that the three treatments can be ranked as best, lifestyle, then Metformin and lastly placebo. The average QALYs gained per person compared to the placebo treatment was 2.3 for Metformin and 4.2 for lifestyle. Thus, patients that made lifestyle changes instead of just taking the placebo lived 4.2 years longer and saved $41,712. Metformin is always preferred over the placebo, while lifestyle is preferable to Metformin unless there is a high discount rate or large indirect costs. At a discount rate of 12%, Metformin results in better outcomes over lifestyle and placebo over lifestyle at 46%. This addresses why some patients choose Metformin over a lifestyle change. While these are large discount rates, experimental studies show that when it comes to exercise, smoking and BMI discount rates can vary from .09 to .38.23
The next step is to account for the indirect cost in one of two ways. One way is to look at the average household income and treat it as a direct cost per hour that is used to exercise. Average household income in 2007 was $50,233 24, or about $24.15 per hour. The individuals in the lifestyle group were asked to exercise an additional 1.5 hours per week, resulting in an average household opportunity cost per year of $1883.73. However, because the amount of time needed to exercise is minimal, the average person could do this at home or during a lunch break without losing pay. This is then seen more as the cost of lost leisure time instead of lost wages. Accounting for the loss of leisure time leads to equation 2. Equation 2 gives an ICER of 4240.4 for lifestyle vs. placebo and an ICER of 21938.3 for lifestyle vs. Metformin.
The other way to address indirect costs is to treat them as the patients’ willingness to pay not to change. Past studies have shown that patients are better off when they make lifestyle changes. Less than 1% of patients make these changes. This means that there is a factor unaccounted for in previous studies. This article does not attempt to cover all the factors that could lead to a patient not wanting to make lifestyle changes. We do however acknowledge their existence and estimate their cost. This is done by seeing where the ICER flips. The ICER for lifestyle vs. Metformin flips when the indirect cost is $256.19.
This means that patients that chose Metformin over diet and exercise have a WTP of $256.29 for that year. The diet and exercise routine however only need to be followed five days a week to see results. This was calculated to be an extra 15 minutes a day or 78 hours a year, resulting in a daily WTP of $3.30 ($2.74 – $3.86 CI) not to exercise or eat healthily. This patient either does not fully understand the risks and benefits or simply does not wish to pay for additional QALYs. Any intervention with an ICER above 0 would be outside their WTP.
One-way, two-way, and Monte Carlo sensitivity analyses were used to test the accuracy of our model. The one-way sensitivity analysis was performed to determine whether the results were sensitive to certain parameters in the model. This is done by varying inputs (+/- 25%) at a time while holding other inputs constant. The outcomes are then compiled into the tornado graph below for analyses. The horizontal bars in Figure 2 represent the ICER range associated with the high and low values for that particular input parameter.
Figure 2 shows that the largest swings in the ICERs are caused by transition probabilities cost of the health states and the discount rate. Cost of diabetes and the transition rate for lifestyle to diabetes are considered to be highly reliable as they come from the randomized controlled trial literature. The change in the ICER caused by the discount rate can explain why we see some patients able to make the lifestyle changes while others are not. The Monte Carlo analysis showed little variance and provided further evidence of the accuracy of our model.
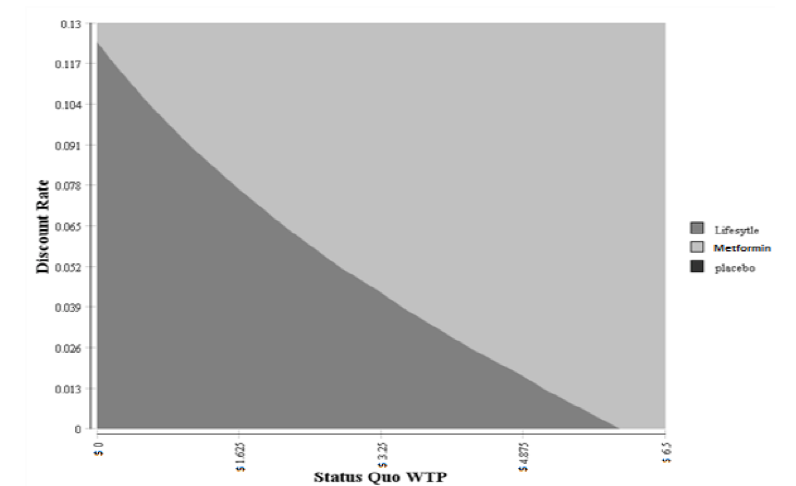
The two-way sensitivity analyses were performed by varying two inputs (WTP and discount rate) while keep all other inputs constant. This allows us to examine the switching point of preference of one treatment over another. The results of this two-way sensitivity analyses are shown in Figure 3. The lifestyle treatment was the dominant strategy (less costly and more effective) when the discount rate was under 12% and the WTP was under $4.02. The cost savings for the lifestyle ranged from $31,284 to $52,140 per patient. The effectiveness ranged from a 3.15 to 5.25 QALYs per patient.
Patients had higher QALYs (4.2, 1.7) and lower lifetime medical costs ($41,712; $10,703) if they were part of the lifestyle treatment group. Patients that make this change can be assumed to have a lower discount rate (below 12%) when it comes to diet and exercise. At a discount rate of 3%, people have a WTP of $3.30 ($2.74 – $3.86 CI) a day not to change their lifestyle. Thus, any health intervention that costs less than $3.30 a day, that helps patients make these changes, would be cost saving and improve QALYs. At a discount rate of 12%, people are paying less than $0.80 a day not to diet and exercise. This higher discount rate makes it much more difficult to have cost-saving health interventions. The majority of the current literature uses a base standard discount rate of 3%. This assumption is fine of young healthy individuals, but not for those with high BMI.23 Health interventions that could potentially lower these discount rates should be considered. Another option would be to reduce indirect costs by increasing motivation.
Increasing motivation to make lifestyle changes could be accomplished by way of temptation bundling. A paper by Katherine Milkman (2014)25 shows how people are willing to tie something they like doing (listening to an audiobook) with something they do not like doing (exercising). If they can only do one while doing the other, this is known as a temptation bundle. Temptation bundling has been shown to increase gym frequency by 51%. This could be adapted to lifestyle changes as the patient ties something they have a positive WTP for (would pay to listen to an audiobook or watch a show) to something they a negative WTP for (would pay not to exercise). This leads to lower indirect costs. Temptation bundling has been applied to diabetes behaviors, including attending medical appointments, weight loss, exercise, medication adherence and blood glucose monitoring. Some of these positive incentives include reminder letters, gas gift cards, lotteries and prizes for weight loss or medication adherence.26 Further study should be done on the effects of temptation bundling, calculating personal discount rates, and the WTP for enforcement of the bundle.
This article has a few limitations, the first of which is the quality of data used in the model. This study relies heavily on the present body of literature and the accuracy of evidence generated by nation studies. Another important limitation is about the assumptions on which the analysis is based, which were necessary to simplify the model. Specifically, this was about the transition probabilities and QALYs. Transition rates were lacking in some cases and thus assumed to remain constant over time. QALYs were derived from different literature sources and considered to be acceptable when applied to different populations. Despite these drawbacks, which are typical of most model-based economic evaluations, our study is the first to address the drastic variance in discount rates while looking at WTP.
In conclusion, we find that lifestyle changes produce higher QALYs than Metformin or placebo. The cost savings outcomes of lifestyle changes, however, are dependent on personal discounting and indirect cost of diet and exercise. At a standard discounting rate of 3%, people have a WTP of $3.30 ($2.74 – $3.86 CI) a day not to change diet and exercise habits. Even though lifestyle changes have an overall lower cost and higher QALYs most patients do not adhere to medical advice. This is due in part because of the high discounting rate for changes to diet and exercise. To improve patient adherence to medical advice more attention needs to be given to discount rates.
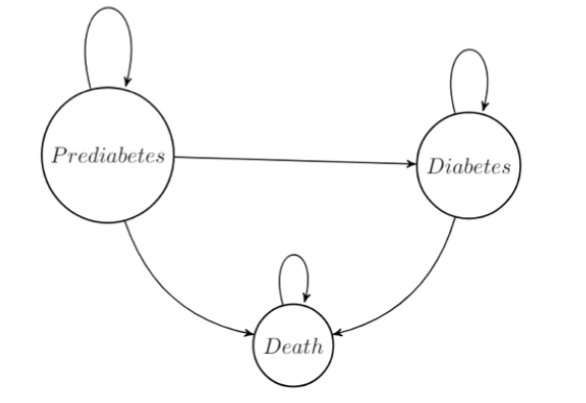
Table 1: Costs for Markov Health States
Costs | Value |
Prediabetes (Placebo) | $ – |
Prediabetes (Metformin) | $ 50 |
Prediabetes (Lifestyle -direct Cost) | $ 550 |
Prediabetes (Lifestyle -indirect Costs) | $ 256 |
Diabetes | $ 5,400 |
Table 2: Markov Transition Probabilities
Transitions | Value |
Transition Prediabetes to Diabetes (Placebo) | 0.11 |
Transition Prediabetes to Diabetes (Metformin) | 0.07 |
Transition Prediabetes to Diabetes (Lifestyle) | 0.05 |
Morbidity multiplier for Diabetes | 0.014 |
Table 3: Quality Adjusted Life Years for Markov Health States
QALYs | Value |
Placebo | 0.75 |
Lifestyle | 0.77 |
Metformin | 0.76 |
Diabetes | 0.63 |
Death | 0.00 |
Table 4: Incremental Cost-Effectiveness Ratios
Cost Saving per Patient | Mean | Standard Deviation |
Metformin vs. Placebo | $31,008.77 | 144.32 |
Lifestyle vs. Placebo | $41,712.71 | 138.15 |
Lifestyle vs. Metformin | $10,703.94 | 127.56 |
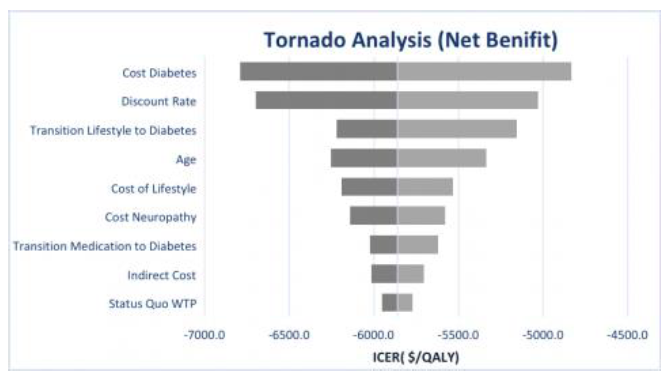
Table 5: Monte Carlo Simulation Results
Cost Saving per Patient | Mean | Standard Deviation |
Metformin vs. Placebo | $31,008.77 | 144.32 |
Lifestyle vs. Placebo | $41,712.71 | 138.15 |
Lifestyle vs. Metformin | $10,703.94 | 127.56 |
Justin Whetten is a Health Economist at the University of New Mexico hospital. His primary research fields are Health Economics, Health Services Research, and Health and Education Disparities in rural communities and developing countries. His current research includes Econometric and Quasi-Experimental designs; Cost-Effectiveness Analysis; and Simulation Modeling. He is currently employed as a health economist for the access to critical cerebral emergency support services (ACCESS) program.
HPHR.org was designed by ComputerAlly.com.
Visit HPHR’s publisher, the Boston Congress of Public Health (BCPH).
Email communications@bcph.org for more information.
Click below to make a tax-deductible donation supporting the educational initiatives of the Boston Congress of Public Health, publisher of HPHR Journal.![]()